Key takeaways
- AI visibility reports need to go beyond "how often we're mentioned" and connect to actual business metrics like traffic, leads, and pipeline
- A useful monthly report tracks four layers: citation share, sentiment, content gaps, and traffic attribution
- Most teams are measuring the wrong things -- prompt volume and mention counts without any downstream context
- The best reports are built around a consistent prompt set that mirrors how your real customers search in AI engines
- Closing the loop between AI citations and revenue requires either a tracking snippet, server log analysis, or GSC integration
If you've tried to explain AI search visibility to a CFO or a client, you already know the problem. You pull up a dashboard showing your brand was mentioned in 34% of ChatGPT responses this month, and the first question is: "So what does that mean for the business?"
It's a fair question. And most visibility reports can't answer it.
This guide is about fixing that. Not just tracking AI mentions, but building a monthly report that connects what's happening in ChatGPT, Perplexity, Claude, and Gemini to things that actually matter: traffic, leads, and revenue.
Why most AI visibility reports fail
The problem isn't that people aren't measuring. It's that they're measuring the wrong things, or measuring the right things in isolation.
A lot of teams have set up some form of AI monitoring -- running prompts manually, checking if their brand shows up, maybe tracking a handful of keywords. That's a start. But a monthly report built on that foundation tends to look like this:
- Brand mentioned in X% of responses
- Competitor Y mentioned more often
- We appeared in Perplexity but not ChatGPT
None of that tells you whether AI search is driving business. It's activity data, not impact data.
The shift you need to make is from "are we visible?" to "what does our visibility do?" That requires connecting three things that most reports treat as separate: AI citations, website traffic from AI sources, and downstream conversions.
The four layers of a useful AI visibility report
Think of your monthly report as having four distinct sections, each answering a different question.
Layer 1: Citation share and brand presence
This is the baseline -- how often does your brand appear in AI-generated answers, and for which prompts?
The key here is working from a defined prompt set. Don't just track your brand name. Track the actual questions your customers ask when they're in buying mode. Things like:
- "What's the best [category] tool for [use case]?"
- "How does [your brand] compare to [competitor]?"
- "What do people recommend for [problem you solve]?"
Run these prompts across multiple AI models -- ChatGPT, Perplexity, Claude, Gemini at minimum. Track not just whether you appear, but where in the response (first mention vs. buried in a list), whether you're cited as a source, and what sentiment surrounds your brand.
Doing this manually at scale is painful. Tools like Promptwatch automate this across 10+ AI models and give you prompt-level visibility scores, so you can see trends over time rather than one-off snapshots.
Layer 2: Competitive context
Visibility in isolation is almost meaningless. What matters is your share of voice relative to competitors.
For each prompt in your tracked set, note which competitors appear alongside you (or instead of you). Over time, this builds a picture of where you're winning, where you're losing ground, and which competitors are gaining AI visibility faster than you.
A heatmap view -- your brand vs. three or four competitors across your key prompts -- is one of the most useful things you can put in a monthly report. It's immediately legible to stakeholders who don't care about the technical details.
Some useful tools for competitive AI visibility tracking:
Layer 3: Content gap analysis
This is where most reports stop being passive and start being useful. Instead of just showing where you're invisible, a good monthly report should identify why you're invisible and what to do about it.
The "why" is usually content. AI models cite your pages because those pages answer the question well. If you're not appearing for a prompt, it's often because you don't have a page that directly addresses what the AI is looking for.
Content gap analysis means identifying the specific prompts where competitors are cited but you aren't, then mapping those to missing or weak content on your site. This turns your visibility report into a content roadmap -- which is something a content team can actually act on.
Platforms that do this well go beyond monitoring to show you the specific topics and angles your site is missing. That's the difference between a dashboard and an optimization tool.
Layer 4: Traffic and revenue attribution
This is the hardest layer to build, but it's the one that makes the report matter to leadership.
AI search traffic shows up in a few places:
- Direct referrals from Perplexity, ChatGPT (where links are included), and similar tools
- "Direct" traffic that's actually dark social or AI-assisted discovery
- Organic traffic that was influenced by AI even if the final click came from Google
To capture this properly, you need at least one of:
- A JavaScript tracking snippet that logs AI referrers specifically
- Google Search Console integration to catch AI Overview-driven clicks
- Server log analysis to see which AI crawlers are hitting your site and which pages they're reading
Once you have this data, you can start connecting the dots: prompts where you're cited -> pages that get cited -> traffic those pages receive -> conversions from that traffic. That's the chain that turns an AI visibility report into a business impact report.
Building the report: a practical structure
Here's a template structure that works for monthly reporting, whether you're presenting to a client, a CMO, or your own team.
Executive summary (one page)
- Overall AI visibility score vs. last month
- Share of voice vs. top three competitors
- Key wins: prompts where visibility improved
- Key gaps: highest-volume prompts where you're still invisible
- One metric tied to business impact (AI-attributed traffic, leads, or pipeline)
Section 1: Visibility scorecard
A table showing your brand's citation rate across each AI model for your tracked prompt set. Something like:
| AI model | Citation rate | vs. last month | vs. top competitor |
|---|---|---|---|
| ChatGPT | 42% | +6% | -8% |
| Perplexity | 61% | +12% | +3% |
| Claude | 28% | -2% | -15% |
| Gemini | 35% | +4% | -5% |
| Google AI Overviews | 47% | +9% | +1% |
This gives a quick read on where you're strong and where you need work. Different AI models have different citation patterns, so a model-by-model breakdown often surfaces surprises.
Section 2: Prompt-level detail
For your top 20-30 tracked prompts, show:
- Your visibility (cited / not cited / mentioned without citation)
- Competitor visibility for the same prompt
- Month-over-month change
- Estimated prompt volume (how often real users ask this)
Prioritize by prompt volume and competitive gap. A prompt where you're invisible but a competitor is consistently cited, and where lots of people are asking that question, is your highest-priority target.
Section 3: Content gap findings
List the specific content pieces your site is missing based on the prompt analysis. For each gap, include:
- The prompt(s) it maps to
- Which competitor is currently getting cited
- Recommended content type (article, comparison, FAQ, etc.)
- Estimated impact if you close the gap
This section is what turns the report from a status update into a work plan.
Section 4: AI traffic and attribution
Show traffic from AI sources over the month, broken down by:
- Referral source (Perplexity, ChatGPT, etc.)
- Landing page
- Conversion rate from AI traffic vs. other sources
- Any pipeline or revenue attributed
If you're early in building this infrastructure, even a rough estimate is better than nothing. Show what you can measure now and flag what you're working to capture.
Section 5: Crawler activity (if available)
This one's often overlooked but genuinely useful. AI models crawl your site before they can cite it. If you can see which pages AI crawlers are visiting, how often, and whether they're hitting errors, you can fix indexing issues before they hurt your visibility.
Crawler log data also tells you which content AI engines find most interesting -- which pages they return to repeatedly. That's a signal worth paying attention to.
Tools that help you build this report
You don't need to build all of this from scratch. Here's a rough map of what different tools contribute:
| Category | What it covers | Tools to consider |
|---|---|---|
| AI visibility monitoring | Citation tracking, share of voice, prompt-level data | Promptwatch, Profound, AthenaHQ, Rankshift |
| Competitive analysis | Competitor citation rates, heatmaps | Promptwatch, Gauge, Scrunch AI |
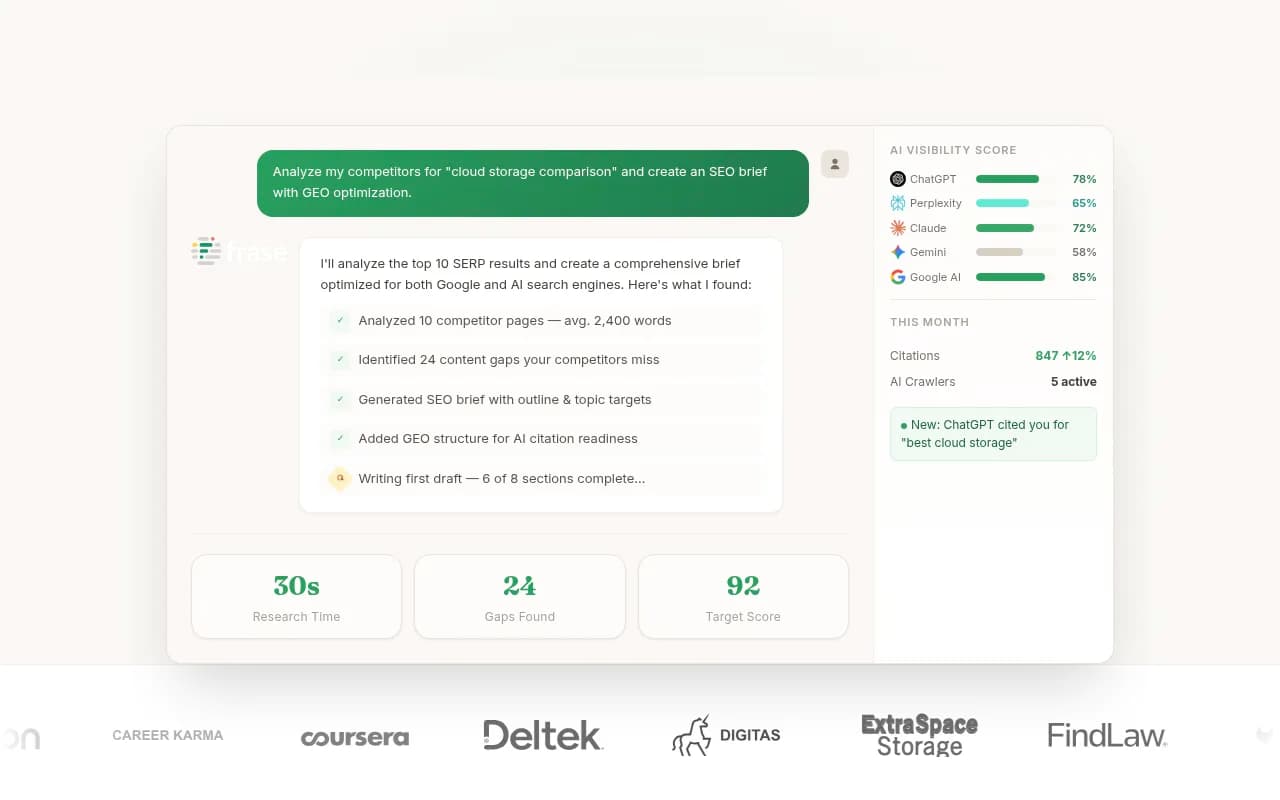
| Content gap analysis | Missing topics, competitor content advantages | Promptwatch, Frase, MarketMuse |
| Traffic attribution | AI referral traffic, conversion tracking | Promptwatch, LLM Clicks, Bear AI |
| Crawler log analysis | AI bot activity, indexing issues | Promptwatch, DarkVisitors |
| Reporting and visualization | Presenting data to stakeholders | Whatagraph, Looker Studio, HubSpot |
A few of these deserve a closer look:
For teams that want a single platform covering most of these layers -- monitoring, gap analysis, content generation, traffic attribution, and crawler logs -- Promptwatch is currently the only tool that handles all of them in one place. Most competitors cover one or two layers but leave you stitching together the rest manually.
Common mistakes to avoid
Tracking too many prompts without prioritization
More prompts isn't better. A set of 300 prompts with no volume data is less useful than 50 prompts ranked by how often real users actually ask them. Focus on prompts that matter to your business.
Ignoring sentiment
Being cited isn't always good. If an AI model mentions your brand as an example of a product with poor customer support, that's visibility you don't want. Track sentiment alongside citation rate.
Reporting visibility without context
A citation rate of 40% sounds good until you realize your main competitor is at 70% for the same prompts. Always show competitive context.
Skipping the attribution layer
This is the most common shortcut, and it's the one that kills the report's credibility with leadership. Even rough attribution data -- "AI referral traffic was up 23% this month" -- is better than no connection to business outcomes.
Treating all AI models the same
ChatGPT, Perplexity, and Google AI Overviews have different citation patterns and different user intents. A user asking Perplexity a research question is in a different mindset than someone asking ChatGPT for a product recommendation. Segment your data by model.
Setting up for month two and beyond
The first month's report is mostly about establishing baselines. The value compounds over time as you can show:
- Which content investments improved visibility (and by how much)
- Which AI models are driving the most attributable traffic
- How your share of voice is trending vs. competitors
- Whether closing specific content gaps actually moved the needle
By month three or four, you should have enough data to make confident claims about what's working. That's when the report stops being a monitoring exercise and starts being a growth tool.
The goal isn't a perfect dashboard. It's a monthly conversation with your team (or your client) about where AI search is sending buyers, whether those buyers are finding you, and what you're doing about it when they're not.
That's a report worth building.