Whatagraph Review 2026
Reporting platform that aggregates data from SEO, paid, and social channels into automated client-ready dashboards. Widely used by digital marketing agencies.
Key takeaways
- Whatagraph is a strong choice for digital marketing agencies that need to automate client reporting across paid, SEO, and social channels without building custom dashboards in Looker Studio or relying on fragile third-party connectors.
- The AI layer (Whatagraph IQ) is genuinely useful for generating performance summaries and answering data questions in plain language — not just a marketing feature.
- Pricing starts at around €199/month (billed annually), which is on the higher end for smaller agencies but justifiable if you're managing 10+ client accounts.
- The platform is purpose-built for reporting and visualization, not for deeper analytics work like attribution modeling or predictive forecasting.
- Competitors like Looker Studio are cheaper (free) but require significantly more setup time; Agency Analytics is a closer alternative at a lower price point.
Whatagraph is a marketing intelligence and reporting platform built specifically for digital marketing agencies and in-house marketing teams that need to consolidate data from multiple channels into clean, client-ready reports. The company, founded in 2015 and headquartered in Vilnius, Lithuania, started as a visual reporting tool and has since evolved into what it now calls a "marketing intelligence platform" — a positioning shift that reflects the addition of AI-powered features under the Whatagraph IQ brand.
The core problem Whatagraph solves is one that anyone who's managed client reporting at an agency knows intimately: you're pulling data from Google Ads, Meta, LinkedIn, TikTok, Google Analytics, and a handful of other platforms, then manually assembling it into a report that looks professional enough to send to a client. That process, done manually, can eat 10-20 hours a week at a mid-sized agency. Whatagraph automates most of it.
The platform is trusted by over 1,000 marketing agencies and brands, with recognizable names like Ticketmaster, Havas, and McCann in its customer list. Case studies on the site cite 100 hours saved per month for one agency and 65% cost savings for another — numbers that are hard to verify independently but align with what you'd expect from eliminating manual reporting workflows.
Key features
Whatagraph IQ (AI assistant) This is the platform's flagship AI layer, included in every plan. It lets you generate reports, get performance summaries, and ask plain-language questions about your data. In practice, you can type something like "summarize last month's paid social performance" and get a structured answer with the relevant metrics pulled automatically. It also generates full reports from prompts — you describe what you want (e.g., "acquisition overview for a DTC brand") and it scaffolds the report structure. This is genuinely faster than building from scratch, though you'll still want to review and adjust the output before sending to clients.
Data connectors (50+ integrations) Whatagraph connects to the major marketing platforms you'd expect:
- Paid: Google Ads, Meta Ads, LinkedIn Ads, TikTok Ads, Microsoft Ads, Adform
- Organic/SEO: Google Search Console, SEMrush, Ahrefs
- Social: Instagram, YouTube, Facebook Pages, Twitter/X
- Analytics: Google Analytics 4, Adobe Analytics
- E-commerce: Shopify
- CRM and other: HubSpot, Salesforce (via some plans)
The connectors are native, meaning you authenticate directly within Whatagraph rather than routing through a third-party middleware like Supermetrics. This matters because it reduces the number of failure points and keeps data fresher. Users consistently cite connector reliability as one of Whatagraph's stronger points compared to alternatives.
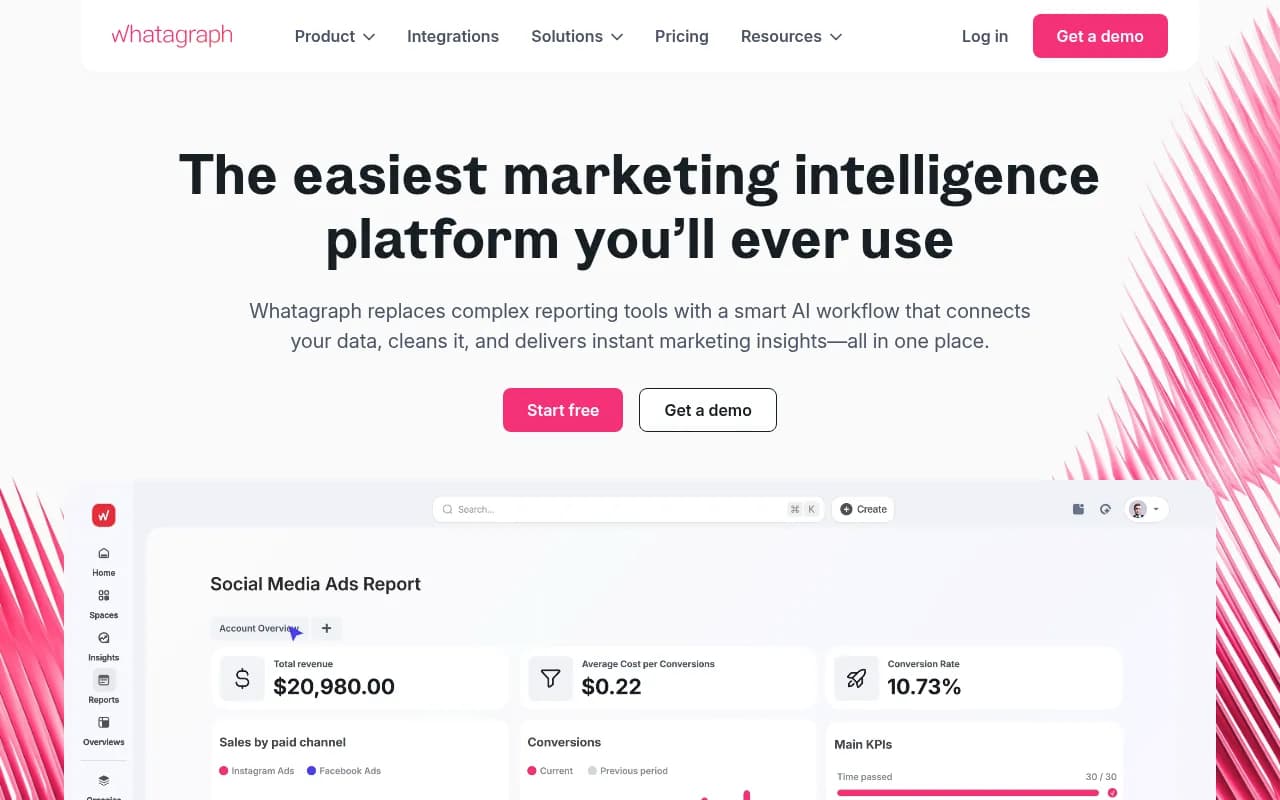
Cross-channel dashboards and reports The visual report builder uses a drag-and-drop interface with pre-built widgets for charts, tables, scorecards, and text blocks. You can build live dashboards that clients can view via a shareable link, or export reports as PDFs. Templates cover common use cases like monthly performance reports, paid media overviews, and SEO summaries. The design quality is noticeably better than Looker Studio out of the box — reports look polished without custom CSS or design work.
Data blending and normalization One of the more technically useful features is the ability to blend data from multiple sources into a single visualization. You can, for example, combine Google Ads and Meta Ads spend into a single "total spend" metric, or create a unified conversion metric that pulls from multiple platforms. This kind of cross-channel math is something Looker Studio technically supports but makes painful to set up. Whatagraph handles it with a more guided interface.
Automated report delivery Reports can be scheduled for automatic delivery via email on daily, weekly, or monthly cadences. You set it up once, and clients receive a branded PDF or a link to their live dashboard on schedule. For agencies managing 20+ clients, this alone can save several hours per week.
White-labeling and client portals Agencies can brand reports with their own logo, colors, and domain. Clients get a dedicated portal where they can view their reports without needing a Whatagraph account. This is a standard feature for agency-focused reporting tools, and Whatagraph's implementation is clean — clients see a professional interface, not a tool with Whatagraph branding.
Data storage and historical data Whatagraph stores your connected data in its own warehouse, which means you can access historical data even if you disconnect a source. This is more useful than it sounds — if a client pauses their ad account or you switch platforms, you don't lose the historical context for your reports.
Goal tracking and performance benchmarks You can set targets for key metrics (e.g., target CPA, target ROAS) and visualize performance against those goals directly in reports. This is a small but meaningful feature for client-facing reporting, where showing progress toward agreed KPIs is often more important than raw numbers.
Who is it for
Whatagraph's sweet spot is digital marketing agencies managing multiple client accounts across paid, organic, and social channels. Specifically, it fits best for agencies with somewhere between 10 and 100 clients, where manual reporting has become a real operational burden but the team doesn't have the technical resources to build a custom data stack. An agency running Google Ads and Meta campaigns for 30 e-commerce clients, for example, would get immediate value from the automated delivery and cross-channel blending features.
In-house marketing teams at mid-market companies also use Whatagraph, particularly when the marketing team is small (3-10 people) and doesn't have a dedicated data analyst. The platform's emphasis on not requiring technical setup makes it accessible to performance marketers who are comfortable with data but not with SQL or BI tools.
The platform is less suited for enterprise marketing teams with complex attribution requirements, data scientists who need raw data access and custom modeling, or very small freelancers managing 1-2 clients who can't justify the starting price. If you're a solo consultant managing a handful of accounts, Agency Analytics or even a well-configured Looker Studio setup would likely be more cost-effective.
Industries where Whatagraph particularly shines: e-commerce brands running multi-channel paid campaigns, SaaS companies tracking acquisition and conversion metrics across channels, and full-service digital agencies where client reporting is a core deliverable.
Integrations and ecosystem
Whatagraph's integration list covers the major marketing platforms well. On the paid side, Google Ads, Meta Ads, LinkedIn Ads, TikTok Ads, and Microsoft Ads are all natively supported. For SEO, both SEMrush and Google Search Console are available. Analytics integrations include Google Analytics 4 and Adobe Analytics. E-commerce teams get Shopify. Social media coverage includes Instagram, YouTube, Facebook Pages, and Twitter/X.
There's no public API for building custom integrations, which is a limitation for teams with proprietary data sources or internal tools they want to include in reports. Some competitors (like Funnel.io) offer more flexibility here for custom data pipelines.
The platform doesn't have a native mobile app, which is a minor gap — client-facing dashboards are accessible via browser on mobile, but the report-building interface is desktop-focused.
There's no Zapier or Make integration listed, which limits automation possibilities for teams that want to trigger report generation or delivery based on external events.
Pricing and value
Whatagraph uses a tiered subscription model billed annually:
- Free: €0/month — limited functionality, useful for evaluation
- Start: ~€199/month (annual) or €249/month (monthly) — covers teams consolidating multiple accounts, includes core connectors and Whatagraph IQ
- Boost: ~€499/month (annual) or €624/month (monthly) — higher data source limits, more users, advanced features
- Max: Custom pricing — enterprise-level, includes dedicated support and custom onboarding
Pricing is in euros, which can create some friction for US-based agencies, though the platform is widely used in North America.
Compared to alternatives: Agency Analytics starts around $12/month per client campaign (with a minimum), making it significantly cheaper for small agencies. Looker Studio is free but requires more setup time and technical knowledge. Funnel.io is more expensive and targets larger teams. DashThis is a closer price competitor.
For an agency saving 50+ hours per month on reporting, the €199-499/month price range is easy to justify. For a small agency managing 5 clients, it's harder to make the math work.
Strengths and limitations
What Whatagraph does well:
- Connector reliability: Native integrations that don't break as often as third-party connector setups. This is a consistent theme in user reviews and case studies.
- Report design quality: Out-of-the-box reports look professional. Clients receive something that looks like it was designed, not assembled from a BI tool.
- AI report generation: Whatagraph IQ genuinely speeds up report creation. Generating a first draft from a prompt and then editing is faster than building from scratch.
- Automated delivery: Set-and-forget report scheduling works reliably, which is the core value proposition for busy agency teams.
- Data blending: Cross-channel metric creation is more accessible here than in most alternatives.
Honest limitations:
- No public API or custom data sources: If you have internal data (CRM exports, proprietary tracking) you want in reports, your options are limited. Funnel.io and Supermetrics handle this better.
- Price point for small agencies: The starting price is hard to justify for agencies with fewer than 10 clients. Agency Analytics is a more cost-effective option at that scale.
- Not a full analytics platform: Whatagraph is a reporting and visualization tool. It doesn't do attribution modeling, predictive analytics, or cohort analysis. Teams that need those capabilities will still need a separate tool.
- Limited customization depth: The drag-and-drop builder is easy to use but has a ceiling. Complex custom visualizations or highly specific layouts can be difficult to achieve without workarounds.
Bottom line
Whatagraph is the right tool for digital marketing agencies that have outgrown manual reporting and need a reliable, client-ready solution that doesn't require a data engineer to maintain. The AI features are a genuine improvement over the previous generation of the product, and the connector reliability is a real differentiator over setups that route through Supermetrics or Google Sheets.
Best use case in one sentence: A 10-person digital agency managing 20+ client accounts across paid and organic channels that wants to eliminate manual monthly reporting and deliver polished, branded dashboards automatically.
Tags:
Frequently asked questions
What is Whatagraph?
How much does Whatagraph cost?
Who is Whatagraph best suited for?
What integrations does Whatagraph support?
How does Whatagraph compare to Looker Studio?
Does Whatagraph have an AI feature?
Similar and alternative tools to Whatagraph