Key takeaways
- Google AI Overviews now appear on roughly 47% of searches and reach over 2 billion monthly users -- tracking them weekly is no longer optional for agencies.
- A good AI Overview report measures citation frequency, prompt coverage, competitor share of voice, and page-level attribution -- not just whether you appeared once.
- The report only has value if it drives action: content gaps, optimization priorities, and clear next steps for the client.
- Several tools now track AI Overview appearances automatically; the right choice depends on your client volume, budget, and whether you need content creation built in.
- Weekly cadence beats monthly for AI Overviews because Google's AI citations shift faster than traditional rankings.
If you're still sending clients a PDF of position-1 rankings and calling it an SEO report, you're already behind. Google AI Overviews have changed what "ranking" means. A page can sit at position 4 and still get cited in the AI Overview at the top of the page -- or a page can sit at position 1 and get completely ignored by the AI. Traditional rank tracking doesn't capture this.
This guide walks through exactly how to build a repeatable weekly reporting workflow for Google AI Overview visibility. It's written for agencies managing multiple clients, but the same structure works for in-house teams. By the end, you'll have a clear template, a tool stack, and a process for turning the data into something clients actually care about.
Why weekly (not monthly) reporting matters for AI Overviews
Traditional SEO rankings are relatively stable. A page that ranks #3 today will probably rank #3 next week. AI Overview citations are different. Google's AI pulls from a dynamic pool of sources, and which pages get cited can shift based on content freshness, new competitors publishing, or changes to how Google's AI interprets a query.
Agencies that check AI Overview visibility monthly are essentially flying blind for three weeks at a time. Weekly reporting lets you:
- Catch citation drops before a client notices traffic changes
- Spot new competitor citations quickly and respond
- Tie content publishing to visibility improvements in near-real-time
- Show clients momentum (or the lack of it) with enough data points to be meaningful
The weekly cadence also makes the report feel alive. Monthly reports are often ignored because they feel like history. A weekly report is a decision-making tool.
What to measure: the core metrics for an AI Overview report
Before you pick a tool or build a template, get clear on what you're actually tracking. Here are the metrics that belong in every weekly AI Overview report.
Citation rate
How often does the client's content appear as a cited source in AI Overviews for their tracked prompts? Express this as a percentage: if you're tracking 100 prompts and the client appears in 34 AI Overviews, that's a 34% citation rate. Track this week over week.
Prompt coverage
Which specific prompts is the client appearing for? Which ones are they missing? This is more granular than citation rate -- it tells you where the visibility is concentrated and where the gaps are. A client might have a 40% citation rate but all of it is on low-volume informational queries, with zero coverage on high-intent purchase queries.
Share of voice vs. competitors
AI Overviews typically cite 3-5 sources. Who else is getting cited alongside your client -- and who's getting cited instead of them? Share of voice tells you whether the client is gaining or losing ground relative to specific competitors. This is often the most compelling metric for client conversations.
Page-level citation data
Which specific pages are being cited? This matters because it tells you what's working content-wise, and it helps you identify pages that are close to getting cited but aren't quite there yet. A page that appears in AI Overviews for 8 prompts is worth protecting and expanding. A page that appears for zero prompts despite covering a relevant topic is a candidate for optimization.
Week-over-week change
Every metric above should have a delta. Clients don't just want to know where they stand -- they want to know if things are moving. A simple +/- column next to each metric is enough.
The weekly report template: section by section
Here's how to structure the actual report. This works as a Google Slides deck, a Notion page, a Looker Studio dashboard, or a simple Google Doc. The format matters less than the consistency.
Section 1: Executive summary (one page)
Three numbers, one paragraph. The three numbers: citation rate this week, change from last week, and share of voice rank among tracked competitors. The paragraph: what changed, why it matters, and what you're doing about it. This is the section clients actually read. Keep it under 150 words.
Section 2: Prompt coverage breakdown
A table showing every tracked prompt, whether the client appeared in the AI Overview, which page was cited, and which competitors also appeared. Color-coding helps: green for cited, red for not cited, yellow for cited but a competitor ranked above them.
| Prompt | Client cited? | Page cited | Top competitor cited |
|---|---|---|---|
| best project management software | Yes | /blog/pm-tools | Monday.com |
| how to manage remote teams | No | -- | Atlassian |
| project management for agencies | Yes | /solutions/agencies | Asana |
| agile vs waterfall | No | -- | Atlassian |
This table is the core of the report. Everything else supports it.
Section 3: Share of voice chart
A simple bar or line chart showing the client vs. 3-5 competitors across all tracked prompts. Show this week and last week side by side. If a competitor gained significantly, note it. If the client gained, celebrate it briefly and explain what drove it.
Section 4: Page performance
Which pages are getting cited most? Which pages appeared for the first time this week? Which pages dropped out? A short table with page URL, number of prompts cited for, and week-over-week change covers this well.
Section 5: Action items
This is the section most agencies skip, and it's the most important one. Every report should end with 2-4 specific actions based on the data. Not vague recommendations -- actual tasks:
- "Update /blog/pm-tools to add a direct answer to 'what is the best project management software for small teams' in the first paragraph"
- "Publish a new page targeting 'agile vs waterfall for agencies' -- Atlassian is currently the only cited source and their content is thin"
- "Add FAQPage schema to /solutions/agencies to improve extraction likelihood"
If the report doesn't have action items, it's just a status update. Action items are what justify the agency retainer.
Tool stack: what to use and when
You need at least one tool that tracks AI Overview appearances automatically. Manual checking doesn't scale beyond a handful of prompts, and it's not reproducible week to week.
Here's a comparison of the main options agencies use in 2026:
| Tool | AI Overview tracking | Competitor tracking | Content gap analysis | Reporting/export | Best for |
|---|---|---|---|---|---|
| Promptwatch | Yes (10 AI models) | Yes, with heatmaps | Yes, with content generation | Looker Studio + API | Agencies wanting full action loop |
| SE Ranking | Yes | Yes | Limited | Yes | Mid-size agencies |
| Semrush | Yes (fixed prompts) | Yes | Limited | Yes | Agencies already on Semrush |
| Rankability | Yes | Yes | Yes | Yes | Agency-focused reporting |
| Thruuu | Yes | Limited | No | Limited | Content teams |
| Nightwatch | Yes | Yes | No | Yes | Rank tracking-first teams |
| AccuRanker | Yes | Yes | No | Yes | High-volume rank tracking |
For agencies that want to go beyond tracking and actually fix what the data reveals, Promptwatch is worth a close look. Its Answer Gap Analysis shows exactly which prompts competitors appear for that your client doesn't -- and the built-in AI writing agent can generate content specifically engineered to get cited. Most other tools stop at the monitoring step.
For agencies that primarily need rank tracking with AI Overview visibility layered on top, SE Ranking and AccuRanker are solid choices.
Rankability is worth mentioning specifically for agencies because it's built around agency reporting workflows rather than individual brand monitoring.
Thruuu is a lighter option that works well for content teams who want to monitor AI Overview appearances without the full platform overhead.
Setting up your prompt list: the foundation of the report
The report is only as good as the prompts you're tracking. Most agencies make the mistake of tracking too many generic head terms and not enough specific, intent-driven queries.
How to build the right prompt list
Start with the client's core topics and expand into question-based queries. AI Overviews are most commonly triggered by:
- "How to" queries ("how to manage a remote team")
- Comparison queries ("Asana vs Monday.com")
- "What is" definitions ("what is agile project management")
- Best-of queries ("best project management software for agencies")
- Troubleshooting queries ("why is my team missing deadlines")
Aim for 50-150 prompts per client depending on the plan. Fewer than 50 and you won't have enough data to spot patterns. More than 150 and the report becomes unwieldy.
Segment prompts by intent: informational, commercial, and navigational. Track them separately. A client might have strong informational coverage but zero commercial coverage -- that's a strategic gap worth highlighting.
Prioritizing prompts by volume and difficulty
Not all prompts are equal. A prompt that triggers AI Overviews on 50,000 monthly searches matters more than one with 200 searches. Tools like Promptwatch provide volume estimates and difficulty scores for each prompt, which lets you prioritize which gaps to close first. Without this data, you're optimizing blind.
The content optimization workflow that feeds the report
The report reveals gaps. The optimization workflow closes them. Here's the process that connects the two.
Step 1: Identify uncited prompts with high volume
From the prompt coverage table, filter for prompts where the client isn't cited and competitors are. Cross-reference with volume data. These are your highest-priority targets.
Step 2: Audit the existing page (if one exists)
If the client has a page that should be getting cited for a prompt but isn't, check:
- Does the page answer the question directly in the first paragraph? Google's AI extracts passages, so the answer needs to be near the top.
- Are H2/H3 headings structured to match the query? A heading that reads "Our Approach to Remote Work" won't get extracted for "how to manage remote teams." One that reads "How to manage remote teams effectively" might.
- Is there FAQPage or HowTo schema markup? Structured data helps Google's AI understand what the page is about and extract it accurately.
- Is the page fast enough? Core Web Vitals still matter for AI crawling.
Step 3: Create or update content
For gaps where no page exists, create one. For gaps where a page exists but isn't getting cited, update it. The key principle from research across thousands of AI Overview results: lead with the answer, then elaborate. Google's AI doesn't want to wade through three paragraphs of context before finding the answer. Put the direct response in sentence one.
Content that performs well in AI Overviews tends to:
- Open each section with a clear, quotable answer
- Use short paragraphs (2-3 sentences)
- Include bullet lists for multi-part answers
- Define key terms explicitly
- Cover the topic with enough depth that the AI trusts it as a primary source
Step 4: Track the impact in next week's report
After publishing or updating content, note it in the report. The following week, check whether the page started appearing in AI Overviews for the target prompts. This closes the loop and gives clients visible proof that the work is producing results.
Common mistakes agencies make with AI Overview reporting
Tracking the wrong prompts
Generic head terms like "project management" rarely trigger AI Overviews in a useful way. Long-tail, question-based queries are where AI Overviews are most active. If your prompt list looks like a traditional keyword list, rebuild it.
Reporting without context
A citation rate of 34% means nothing without context. Is that good or bad? Compared to what? Every metric needs a benchmark: last week's number, the competitor average, or an industry baseline. Without context, clients can't evaluate whether the report is good news or bad news.
Ignoring page-level data
Agencies often report on overall citation rate and stop there. But the page-level data is where the actionable insights live. Which pages are getting cited? Which aren't? That's what drives the content strategy.
Not connecting visibility to traffic
AI Overview citations don't always drive clicks -- but sometimes they do. If you're not tracking AI-driven traffic separately from organic traffic, you can't prove the value of the work. Tools that connect AI visibility to actual site visits (via GSC integration, a tracking snippet, or server log analysis) are worth the extra setup time.
Sending the report without action items
This is the most common mistake. A report that ends with "citation rate is up 3%" is a status update. A report that ends with "citation rate is up 3%, driven by the /blog/pm-tools update we made last week -- this week we're targeting the 'agile vs waterfall' gap where Atlassian is the only cited source" is a strategy document. The second version justifies the retainer.
Automating the weekly workflow
Once the template is built, the goal is to make it as automated as possible so the analyst time goes into interpretation and action items, not data collection.
Most AI Overview tracking tools can export data via API or connect to Looker Studio. Set up a Looker Studio dashboard that pulls data automatically each week, then spend 30-45 minutes per client interpreting the data and writing the action items section. That's the part that can't be automated -- and it's the part clients actually pay for.
For agencies managing 10+ clients, tools like Zapier or Make can automate the data pipeline from your tracking tool to your reporting template.
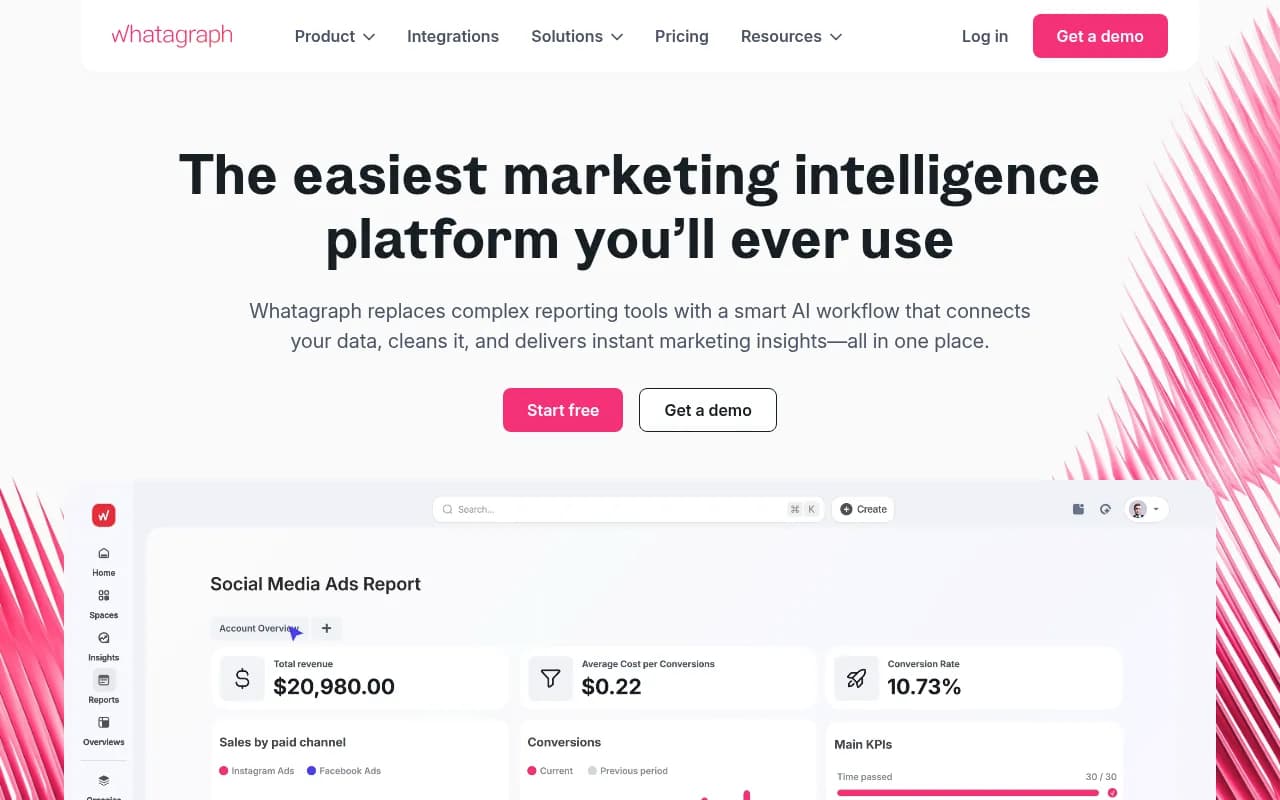
Whatagraph is worth considering for agencies that want a polished client-facing report format without building everything from scratch in Looker Studio.
Putting it together: the weekly rhythm
Here's what the weekly workflow looks like in practice:
- Monday: Data pulls automatically from your tracking tool into the dashboard
- Tuesday: Analyst reviews the data, writes the executive summary and action items (30-45 min per client)
- Wednesday: Reports sent to clients
- Thursday/Friday: Content updates and new pages published based on the previous week's action items
That's it. The report is a weekly decision-making tool, not a monthly retrospective. The cadence keeps the work moving and gives clients a clear sense of progress.
The agencies that will win AI search in 2026 aren't the ones with the fanciest dashboards. They're the ones who treat AI Overview visibility as an ongoing optimization process -- track, act, track again -- rather than a one-time audit. Build the report template once, run it every week, and let the data tell you where to focus.