Key takeaways
- Workflow automation tools like Zapier and n8n can eliminate the manual work of pulling AI visibility data, formatting reports, and distributing them to stakeholders
- n8n is better for teams with developer resources who want full control and self-hosting; Zapier is faster to set up for non-technical marketers
- A practical AI visibility pipeline has four stages: data collection, normalization, storage, and distribution
- You don't need to build everything from scratch -- AI visibility platforms like Promptwatch expose API and webhook endpoints that plug directly into both tools
- Start simple: one trigger, one data source, one destination. Complexity can come later.
AI visibility reporting is still mostly manual in 2026. Someone logs into a dashboard, screenshots a chart, pastes numbers into a spreadsheet, and forwards it to the team every Monday. If that's you, this guide is for you.
The good news: the tooling to automate this is mature, accessible, and doesn't require a full engineering team. Zapier and n8n are the two most widely used workflow automation platforms right now, and both can connect to AI visibility APIs to pull citation data, brand mention scores, and prompt rankings on a schedule -- then push that data wherever your team actually looks at it.
This guide walks through how to design and build that pipeline from scratch.
Understanding the two tools before you build anything
Before picking a tool, it's worth being honest about the tradeoff.
Zapier connects over 8,000 apps through a no-code interface. You build "Zaps" -- trigger-action pairs -- using a visual editor. There's no server to manage, no code to write (unless you want to), and most integrations work out of the box. The downside is cost: Zapier's pricing scales with task volume, and complex multi-step workflows can get expensive quickly.
n8n takes the opposite approach. It's a developer-first platform you can self-host (on Docker, a VPS, or n8n Cloud), and it gives you full control over data flow, branching logic, error handling, and custom code execution. The free self-hosted tier has no task limits. The tradeoff is setup time -- you need to be comfortable with JSON, HTTP requests, and basic server administration to get the most out of it.
Here's a quick comparison to help you decide:
| Dimension | Zapier | n8n |
|---|---|---|
| Setup time | Minutes | Hours (self-hosted) |
| Technical skill needed | Low | Medium-High |
| Pricing model | Per task | Per workflow run (or self-hosted free) |
| Custom code support | Limited (JavaScript) | Full (JavaScript + Python) |
| Self-hosting | No | Yes |
| Native AI integrations | Yes (OpenAI, etc.) | Yes (OpenAI, Anthropic, etc.) |
| Best for | Non-technical marketers | Developers and ops teams |
| API/webhook support | Yes | Yes |
| Error handling | Basic | Advanced |
Neither tool is objectively better. The right choice depends on your team's technical comfort and how much data volume you're dealing with.
What an AI visibility reporting pipeline actually looks like
Before writing a single Zap or n8n node, sketch out the four stages of your pipeline:
- Trigger -- what kicks off the workflow (a schedule, a webhook, a new row in a sheet)
- Data collection -- pulling visibility scores, citation counts, brand mentions, or prompt rankings from your AI visibility platform's API
- Normalization -- formatting the raw data into something readable (calculating week-over-week changes, filtering by competitor, etc.)
- Distribution -- sending the processed data to Slack, Google Sheets, a dashboard, or an email digest
Most teams start with a weekly scheduled report. That's the right place to start. Daily reports sound appealing but generate noise; weekly cadences force you to look at trends rather than reacting to individual data points.
Stage 1: Setting up your data source
Your AI visibility platform needs to expose data programmatically. Most modern GEO platforms do this via REST APIs or webhooks.
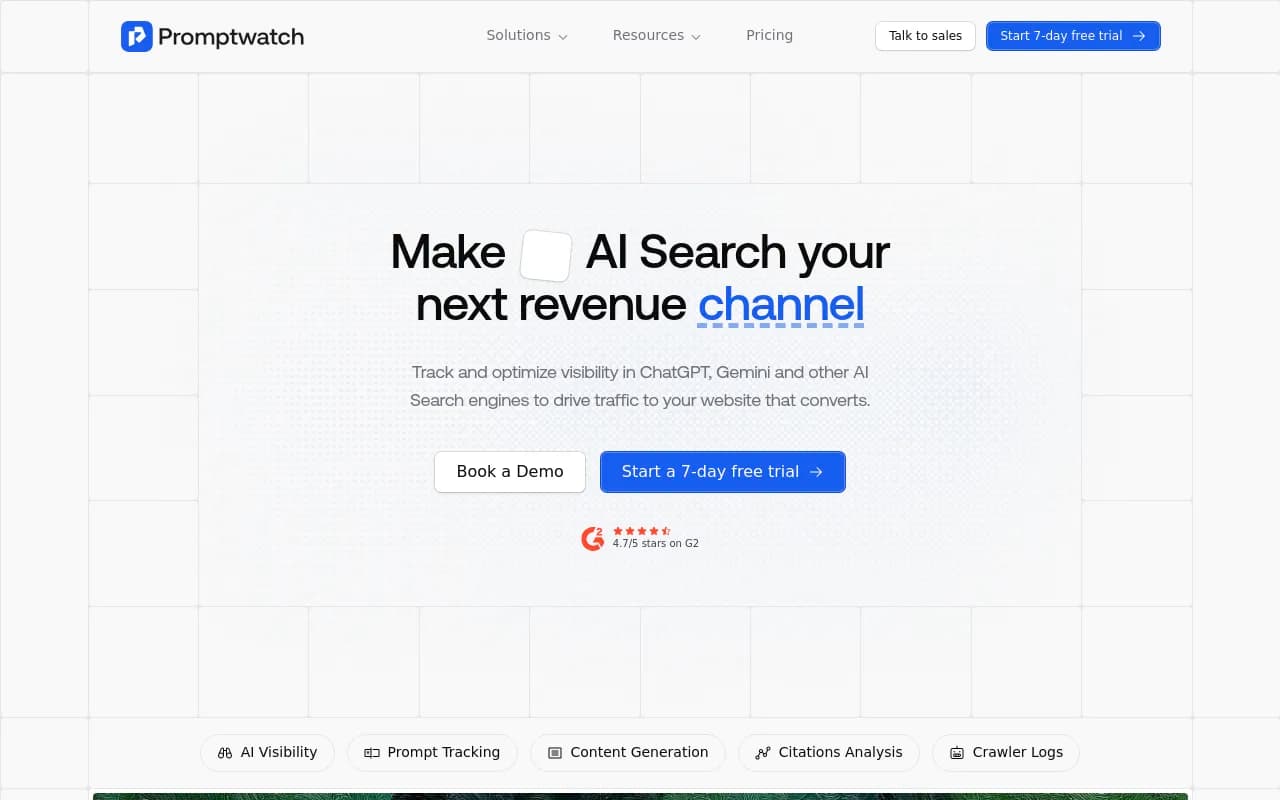
Promptwatch, for example, has an API that lets you pull visibility scores, citation data, and prompt rankings for your tracked brand and competitors. If you're using Promptwatch, you'll find your API key in the platform settings. Keep it somewhere safe -- you'll need it in the next step.
Other platforms in the catalog also offer API access worth checking:
Once you have an API key and understand the endpoint structure (typically something like GET /api/v1/visibility?brand=yourbrand&period=7d), you're ready to build.
Stage 2: Building the pipeline in Zapier
Setting up a scheduled trigger
In Zapier, create a new Zap and choose "Schedule by Zapier" as your trigger. Set it to run weekly -- Monday at 8am works well for most teams, since the report lands before the week's planning conversations.
Fetching data with Webhooks or the API step
Zapier has a built-in "Webhooks by Zapier" action that lets you make HTTP GET or POST requests. Use this to call your AI visibility platform's API:
Action: Webhooks by Zapier
Method: GET
URL: https://api.promptwatch.com/v1/visibility
Headers:
  Authorization: Bearer YOUR_API_KEY
  Content-Type: application/json
Query params:
  period: 7d
  brand: your-brand-slug
The response will come back as JSON. Zapier automatically parses it and makes each field available as a variable in subsequent steps.
Normalizing the data
Use Zapier's "Formatter" step to manipulate the data. Common transformations:
- Round decimal scores to one decimal place
- Calculate the difference between
current_scoreandprevious_scoreto get a week-over-week delta - Use a conditional ("Filter" step) to only continue the workflow if the score dropped by more than 5 points -- so you're not sending noise
Distributing the report
The final step depends on where your team lives:
Slack: Use the Slack action to post a formatted message to a #ai-visibility channel. Use Zapier's text formatting to build a readable digest:
Weekly AI Visibility Report
Brand score: {{visibility_score}} ({{delta}} vs last week)
Top cited page: {{top_page}}
Competitors: {{competitor_1_score}} | {{competitor_2_score}}
Google Sheets: Append a new row to a tracking spreadsheet with the date, score, and key metrics. Over time this builds a historical dataset you can chart.
Email: Use Gmail or Outlook to send a formatted HTML email to stakeholders who don't use Slack.
Stage 3: Building the same pipeline in n8n
n8n gives you more control at every step. Here's how the same pipeline looks:
The workflow structure
In n8n, you'll build a workflow with these nodes in sequence:
- Cron node -- triggers on a schedule (weekly, Monday 8am)
- HTTP Request node -- calls your AI visibility API
- Function node -- normalizes and transforms the data
- IF node -- conditional branching (e.g., alert only if score drops)
- Slack node / Google Sheets node / Email node -- distributes the output
The HTTP Request node
{
  "method": "GET",
  "url": "https://api.promptwatch.com/v1/visibility",
  "headers": {
    "Authorization": "Bearer {{ $env.PROMPTWATCH_API_KEY }}",
    "Content-Type": "application/json"
  },
  "queryParameters": {
    "period": "7d",
    "brand": "your-brand-slug"
  }
}
Store your API key as an environment variable in n8n rather than hardcoding it. In the self-hosted version, you set these in your .env file or the n8n UI under Credentials.
The Function node for normalization
This is where n8n pulls ahead of Zapier. You can write real JavaScript to process the API response:
const data = items[0].json;

const currentScore = data.visibility_score;
const previousScore = data.previous_visibility_score;
const delta = (currentScore - previousScore).toFixed(1);
const deltaLabel = delta > 0 ? `+${delta}` : `${delta}`;

return [{
  json: {
    score: currentScore.toFixed(1),
    delta: deltaLabel,
    topPage: data.top_cited_page,
    topPageCitations: data.top_cited_page_count,
    competitors: data.competitors,
    reportDate: new Date().toISOString().split('T')[0],
    alertNeeded: Math.abs(delta) > 5
  }
}];
Conditional alerting with the IF node
Connect the Function node output to an IF node. Set the condition: alertNeeded equals true. If true, route to a Slack node that pings your team with an urgent message. If false, route to a quieter Google Sheets append.
This way, your team only gets pinged when something meaningful changes. The historical data still gets logged either way.
Error handling (don't skip this)
n8n has a built-in error workflow feature. Create a separate "Error Workflow" that catches failures from your main pipeline and sends a Slack message or email so you know when the automation breaks. Without this, a failed API call will silently produce no report and you won't notice for weeks.
In your main workflow settings, set the "Error Workflow" field to point to your error handler.
Stage 4: Adding more data sources
Once your basic pipeline works, you can layer in additional data sources to make the report richer.
Competitor visibility
Most AI visibility APIs let you pull competitor scores alongside your own. Add a second HTTP Request node (or a second API call in the same Function node) to fetch competitor data, then include it in the report output.
Citation source breakdown
If your platform exposes which pages, Reddit threads, or YouTube videos are being cited in AI responses, pull that data too. A weekly "top cited sources" section in your report helps your content team understand what's working.
Prompt-level data
Rather than just a single brand visibility score, pull data at the prompt level. Which specific questions is your brand appearing in? Which ones are you losing to competitors? This turns a vanity metric into an actionable list.
Stage 5: Building a Google Sheets dashboard
Appending rows to Google Sheets on a weekly schedule builds a time-series dataset automatically. After a few months, you have a chart that shows your AI visibility trend without any manual data entry.
Set up your sheet with these columns:
| Date | Brand score | WoW delta | Top page | Top page citations | Competitor A | Competitor B |
|---|---|---|---|---|---|---|
| 2026-03-10 | 72.4 | +2.1 | /blog/best-crm | 847 | 68.1 | 61.3 |
| 2026-03-17 | 74.8 | +2.4 | /blog/best-crm | 912 | 67.9 | 62.0 |
In Zapier, use the "Google Sheets: Append Row" action. In n8n, use the Google Sheets node with the "Append" operation.
Connect this sheet to Looker Studio for a visual dashboard your leadership team can bookmark. Looker Studio has a native Google Sheets connector -- no additional configuration needed.
Common mistakes and how to avoid them
Skipping error handling. Automation that silently fails is worse than no automation. Always add error notifications.
Over-engineering the first version. Start with one data source, one destination, one schedule. Get that working reliably before adding complexity.
Not versioning your workflows. n8n has built-in workflow versioning. Zapier doesn't, so export your Zap configuration as JSON periodically and store it in a Git repo or Notion doc.
Hardcoding API keys. Use environment variables or the credentials manager in both tools. Rotating a compromised key is much easier when it's stored in one place.
Pulling data too frequently. Hourly AI visibility data is rarely actionable and burns through API rate limits. Weekly is usually the right cadence for strategic reporting; daily only makes sense if you're in an active campaign or competitive situation.
Which tool should you actually use?
If you're a marketing or SEO team without dedicated engineering support, start with Zapier. The setup is faster, the UI is forgiving, and you'll have a working pipeline in an afternoon.
If you have a developer on the team, or you're dealing with high data volumes, or you want to avoid per-task pricing at scale, n8n is worth the extra setup time. The self-hosted version is genuinely powerful and the JavaScript Function node removes most of the limitations you'd hit in Zapier.
Make (formerly Integromat) is a third option worth mentioning -- it sits between Zapier and n8n in terms of technical complexity and pricing, and has strong support for complex branching workflows.
For enterprise teams with more complex requirements -- multiple data sources, approval workflows, compliance logging -- Workato is worth evaluating. It's significantly more expensive but handles enterprise-grade complexity well.
Putting it all together
The pipeline you've built by the end of this guide does something that sounds simple but most teams never actually achieve: it automatically collects AI visibility data, calculates what changed, and tells the right people without anyone having to remember to do it.
That's the real value. Not the automation itself, but the consistency. A report that runs automatically every Monday for six months gives you a dataset you can actually make decisions from. A manual process gives you a dataset with gaps wherever someone was on vacation or had a busy week.
Start with the simplest version that works. One API call, one Slack message, one schedule. Then add data sources and destinations as you learn what your team actually reads.
The tooling is ready. The AI visibility data is available. The main thing left is building it.