Key takeaways
- Traditional analytics tools miss the majority of AI search activity -- up to 93% of AI Mode sessions end without a website visit, so standard traffic dashboards show a distorted picture
- A proper AI search growth dashboard needs four data layers: visibility scores, citation tracking, click attribution, and competitor benchmarks
- You can build a lightweight version with a spreadsheet and a few free tools, or go deeper with a dedicated GEO platform that handles all four layers automatically
- The most common mistake is tracking only one AI model -- your dashboard should cover ChatGPT, Perplexity, Google AI Overviews, Claude, and Gemini at minimum
- Visibility without attribution is vanity -- the dashboard only becomes useful when you can connect AI citations to actual revenue
Your Google Analytics dashboard looks fine. Traffic is stable. Rankings haven't moved much. But when a potential customer opens ChatGPT and asks "what's the best [your category] tool for [your use case]," your brand isn't in the answer. That's not a ranking problem. It's a measurement problem.
The data from that interaction never reaches your analytics stack. No session recorded. No impression logged. No click counted. The buyer forms an opinion about your category, builds a shortlist, and moves on -- and your dashboard reports nothing unusual.
This is the structural gap that an AI search growth dashboard is designed to close. This guide walks through exactly how to build one, what to measure, which tools handle which layers, and how to connect visibility data to revenue.
Why your current stack can't see AI search
Traditional SEO analytics tools were built for a world where search meant Google returning ten blue links. You tracked position, impressions, and clicks through Google Search Console. That model still works for traditional organic search, but it misses almost everything happening in AI interfaces.
By March 2026, Comscore data showed ChatGPT at 33.86 million U.S. desktop unique visitors, growing 18.9% month over month. Claude surged 130% month over month to 2.66 million. Across seven major AI chatbot platforms, combined U.S. desktop users hit 44.4 million. These aren't niche research tools anymore -- they're mainstream discovery channels.
The problem is that AI search works differently. When someone asks ChatGPT for a software recommendation, the model generates a narrative answer synthesizing dozens of sources. There's no position one or position ten. There's "mentioned" or "not mentioned," and if you're mentioned, there's a question of how favorably and in what context. None of that shows up in a traditional rank tracker.
The other issue is click attribution. Up to 93% of AI Mode search sessions end without a website visit. A brand can dominate recommendations inside Perplexity or ChatGPT -- genuinely influencing buyer shortlists -- while traditional analytics report zero traffic from those interactions. The marketing team concludes the channel isn't working. The channel is working fine; the measurement isn't.
The four layers of an AI search growth dashboard
A functional dashboard needs four distinct data layers. Most teams try to build this with one or two and wonder why the picture is incomplete.
Layer 1: AI visibility scores
This is the foundation. You need to know, for a defined set of prompts relevant to your category, how often your brand appears in AI-generated answers across the models your audience uses.
The key inputs are:
- A prompt set covering your core use cases, comparison queries, and category questions (e.g., "best project management software for remote teams," "alternatives to [competitor]," "how to [problem you solve]")
- Coverage across multiple models -- ChatGPT, Perplexity, Google AI Overviews, Claude, and Gemini at minimum
- A consistent scoring method so you can track change over time, not just a snapshot
Visibility score alone doesn't tell you much without a baseline and a trend line. The dashboard needs to show whether your score is improving, flat, or declining week over week.
Layer 2: Citation and source tracking
Being mentioned in an AI answer and being cited as a source are different things. Citation tracking tells you which specific pages on your site AI models are pulling from, how often, and in which contexts.
This matters for two reasons. First, it tells you which content is actually working -- which pages are earning citations and which are invisible despite ranking well in traditional search. Second, it shows you where to invest. If your comparison pages are getting cited heavily but your product pages aren't, that's a content signal.
Citation data also extends beyond your own site. Knowing that AI models frequently cite a particular Reddit thread or a competitor's blog post about your category tells you where to publish, what angles to cover, and what sources to build relationships with.
Layer 3: Click and traffic attribution
This is where most AI visibility dashboards fall short. Visibility and citations are leading indicators, but clicks and conversions are what actually matter to the business.
The challenge is that AI-referred traffic doesn't always show up cleanly in analytics. Some of it arrives with referrer data intact (Perplexity is relatively good at passing referrer information). Some arrives as direct traffic. Some never arrives at all because the user got their answer without clicking.
A complete attribution layer needs:
- A tracking snippet or server log analysis to capture AI crawler activity and referral patterns
- Google Search Console integration to capture AI Overview click data
- A way to tag and segment sessions that originated from AI interfaces
When you can connect a citation in ChatGPT to a session in your analytics and eventually to a conversion, the dashboard becomes a revenue tool, not just a vanity metric tracker.
Layer 4: Competitor benchmarks
Visibility scores mean more when you know how they compare. If your AI visibility score is 34%, that could be excellent or terrible depending on whether competitors are at 12% or 67%.
Competitor benchmarking should show:
- Share of voice across your prompt set -- who appears most often for the queries that matter
- Which models favor which competitors (some brands dominate in ChatGPT but are weak in Perplexity)
- Which competitor pages are getting cited most, and why
This layer turns the dashboard from a monitoring tool into a strategic one. You're not just watching your own numbers -- you're understanding the competitive dynamics of AI search in your category.
Building the dashboard: tool options by approach
How you build this depends on your budget, technical resources, and how seriously you're investing in AI search. Here are three practical approaches.
Approach 1: Manual tracking with free tools (low budget)
This works for small teams or early-stage testing. It won't scale, but it gives you a real baseline.
Set up a spreadsheet with your target prompts as rows and your target AI models as columns. Once a week, manually run each prompt in ChatGPT, Perplexity, Claude, and Google AI Overviews. Record whether your brand appeared, what position (first mention, second, etc.), and whether a link to your site was included.
For click attribution, use Google Search Console's AI Overviews filter to capture what's happening in Google's ecosystem. For other models, check your analytics for sessions with referrer domains like perplexity.ai or chat.openai.com.
This approach takes 2-3 hours per week and gives you directional data. It breaks down quickly once you have more than 20 prompts or need to track more than 2-3 competitors.
Approach 2: Lightweight dedicated tools (mid-range)
Several tools handle specific layers of this well without requiring enterprise budgets.
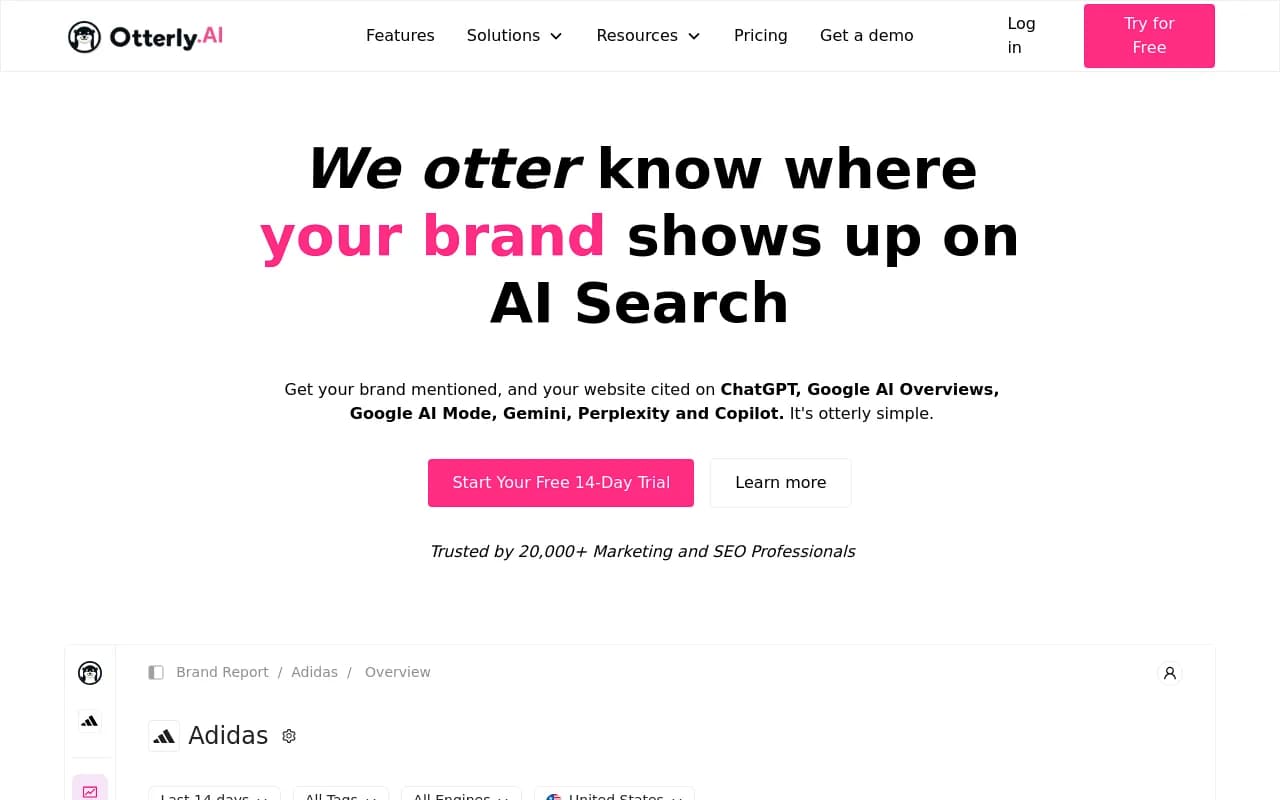
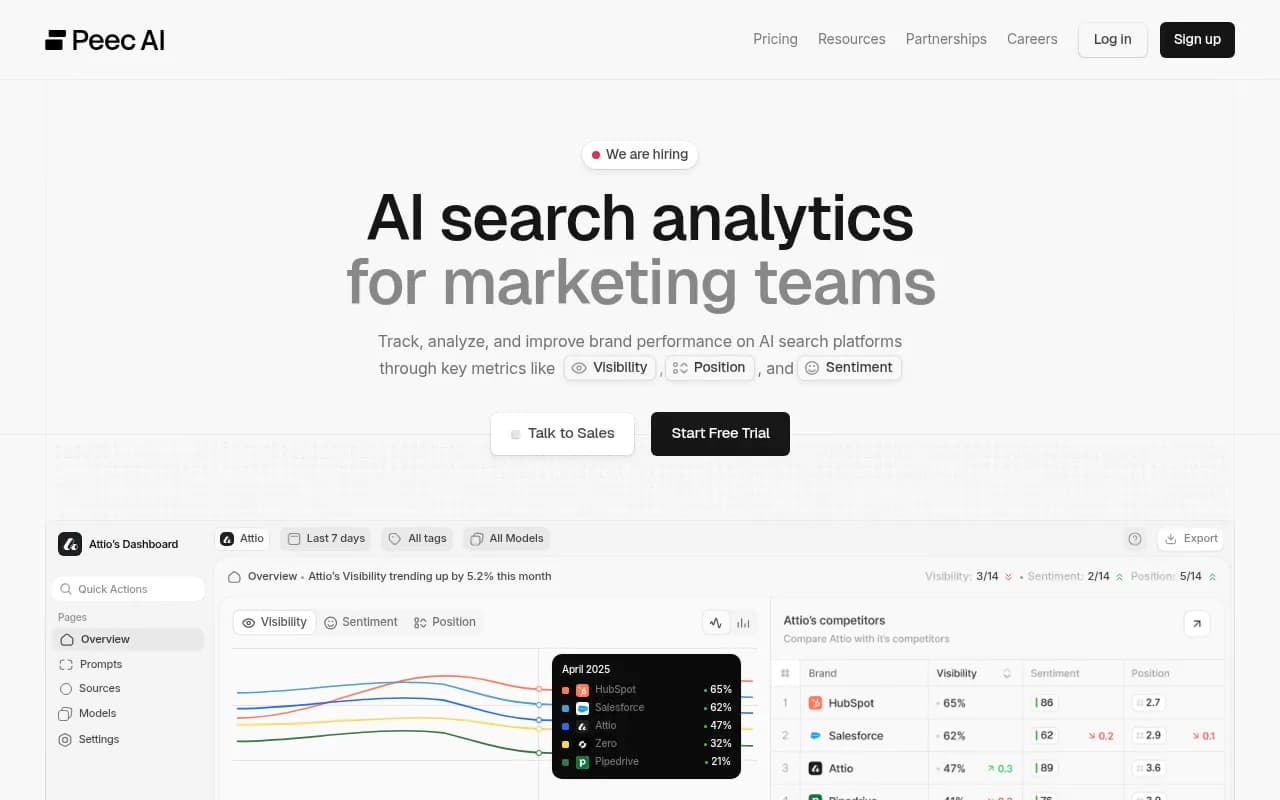
For visibility monitoring, tools like Otterly.AI and Peec AI track brand mentions across AI models at accessible price points.
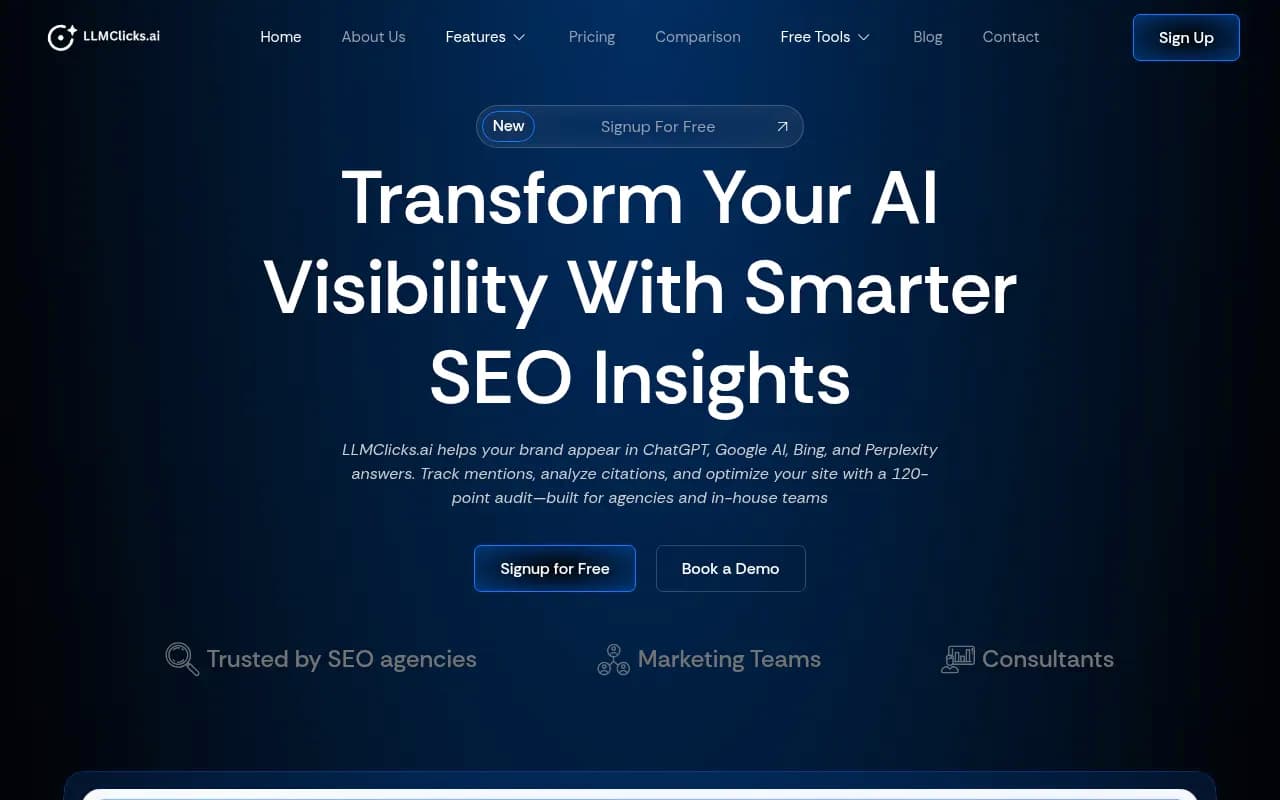
For citation tracking specifically, LLM Clicks focuses on tracking which AI responses are actually driving clicks to your site.
The limitation with this approach is that you're stitching together multiple tools with no unified view. You'll spend time reconciling data across platforms rather than acting on it.
Approach 3: Unified GEO platform (full stack)
This is where all four layers live in one place. A dedicated Generative Engine Optimization platform handles visibility scoring, citation analysis, click attribution, and competitor benchmarking from a single dashboard.
Promptwatch is the platform that covers all four layers end-to-end. It monitors 10 AI models (ChatGPT, Perplexity, Claude, Gemini, Google AI Overviews, Grok, DeepSeek, Copilot, Meta AI, and Mistral), tracks citations at the page level, and connects visibility data to actual traffic through a code snippet, GSC integration, or server log analysis. The AI crawler logs feature is particularly useful for the attribution layer -- it shows in real time which AI crawlers are hitting your site, which pages they're reading, and any errors they're encountering.
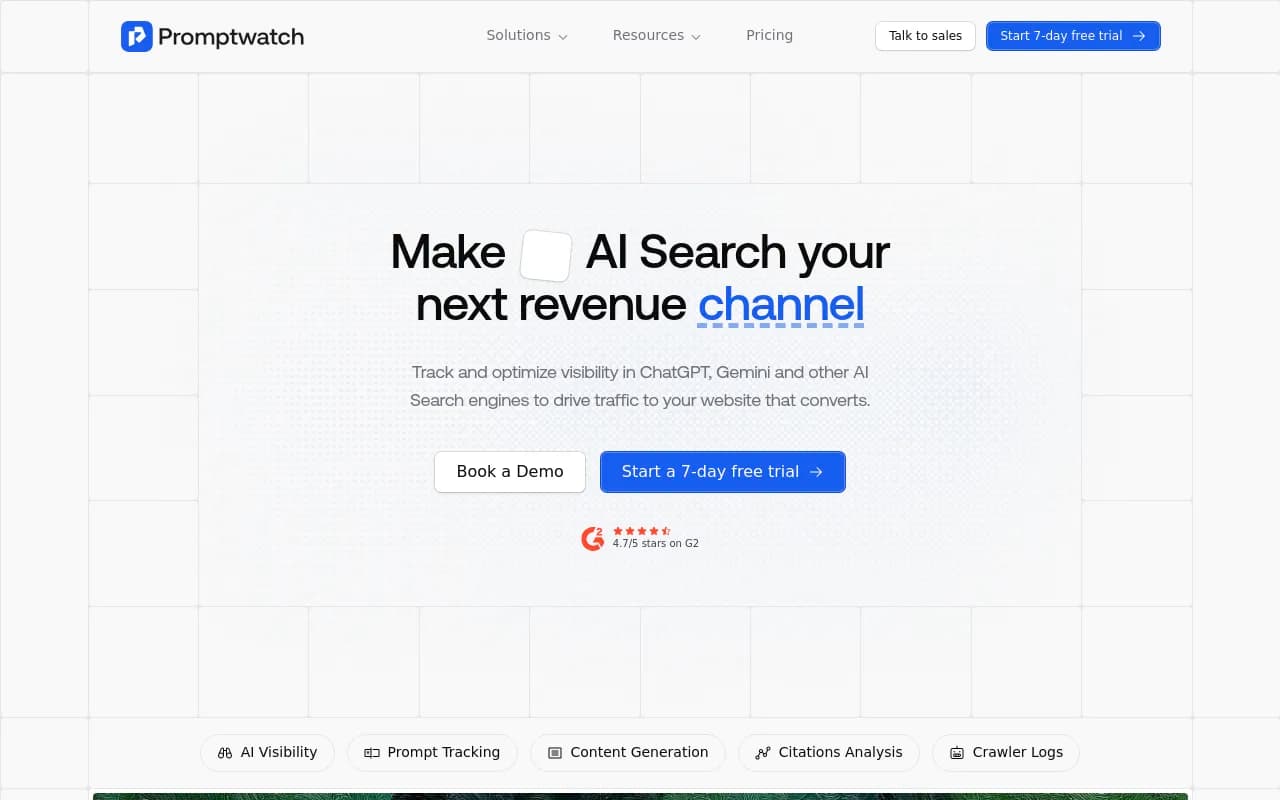
What separates a platform like this from a monitoring-only tool is the action loop. Seeing that your visibility score dropped 8 points is useful. Knowing exactly which prompts you lost, which competitor gained them, and having a content gap analysis that shows what to write to recover -- that's what makes the dashboard actionable.
Other platforms worth evaluating depending on your needs:
Setting up your prompt architecture
The quality of your dashboard depends almost entirely on the quality of your prompt set. This is where most teams underinvest.
A good prompt architecture covers three categories:
Category discovery prompts -- how buyers find solutions in your space. "Best tools for [use case]," "how to [solve problem]," "what software does [job to be done]." These are high-volume, competitive, and the most important to track.
Comparison and alternative prompts -- where buyers evaluate options. "[Your brand] vs [competitor]," "alternatives to [competitor]," "[your brand] review." These prompts often have high purchase intent.
Problem-aware prompts -- questions buyers ask before they know what solution they need. "How do I [problem]," "why is [symptom] happening," "what causes [pain point]." These are harder to win but valuable for early-stage visibility.
For each prompt, you want to know the estimated search volume (some platforms provide this), the difficulty of ranking for it in AI search, and which competitors currently own it. That combination lets you prioritize -- go after high-volume, winnable prompts first rather than spreading effort evenly.
The metrics that actually matter
Not every number in your dashboard deserves equal attention. Here's how to think about prioritization.
AI share of voice is your primary visibility metric. It measures what percentage of relevant AI responses mention your brand, relative to competitors. This is the number to move.
Citation rate by page tells you which content is working. A page with a high citation rate is earning its place in AI training and retrieval. A page that ranks well in Google but has zero AI citations is a candidate for optimization.
Prompt coverage measures how many of your target prompts you appear in at all. If you're tracking 100 prompts and appearing in 23, your coverage is 23%. Growing that number is often easier than improving your position within prompts you already appear in.
AI-attributed sessions and conversions close the loop. This is the hardest metric to capture cleanly, but it's the one that justifies the investment. Even a rough estimate -- "AI search drove approximately X sessions last month, and those sessions converted at Y%" -- is more useful than no attribution at all.
Competitor heatmap shows which models favor which brands. You might be strong in Perplexity but weak in ChatGPT. That's not a uniform "AI visibility" problem -- it's a specific gap in how ChatGPT's training data represents your brand, which points to specific content and citation-building actions.
Common mistakes to avoid
Tracking only Google AI Overviews. Google is important, but ChatGPT and Perplexity are where a significant portion of AI-influenced purchase decisions happen. A dashboard that only covers Google's AI features misses most of the picture.
Using a single persona. AI models give different answers depending on how a question is framed, what location is implied, and what kind of user is asking. A B2B software buyer in the U.S. and a freelancer in Germany asking the same question will often get different recommendations. Your dashboard should test prompts across the personas that match your actual customers.
Ignoring the content gap. Visibility data without content action is just monitoring. The dashboard should connect to a workflow: when you identify prompts where competitors appear and you don't, there should be a clear path to creating the content that closes that gap.
Not tracking AI crawler activity. AI models discover your content by crawling it. If GPTBot or ClaudeBot is hitting your site with errors, or skipping your most important pages, your visibility will suffer regardless of how good your content is. Crawler log analysis is an underused but high-value input.
Measuring too infrequently. AI search is volatile. Model updates, new training data, and competitor content changes can shift your visibility significantly week to week. Monthly snapshots miss too much. Weekly tracking is the minimum; daily is better for competitive categories.
Connecting visibility to revenue
The dashboard becomes a business tool when you can answer: "What is AI search worth to us?"
The attribution chain looks like this:
- AI model cites your content in a response
- User clicks through to your site (captured via referrer or UTM)
- Session is tracked in your analytics
- Session converts (or is attributed to a conversion via multi-touch)
Steps 2-4 are standard analytics work. Step 1 is the new piece. Tools that provide AI crawler logs and referral tracking help you close the gap between "we appeared in an AI response" and "that appearance drove a visit."
For sessions that don't result in a click (the majority), you're working with indirect attribution. Brand lift studies, survey data ("how did you hear about us?"), and pipeline analysis can help quantify the influence of AI visibility on deals that eventually close through other channels.
The honest answer is that AI attribution is still imperfect in 2026. But "imperfect" is much better than "invisible," which is where most teams are today.
Comparison: key tools for each dashboard layer
| Tool | Visibility scoring | Citation tracking | Click attribution | Competitor benchmarks | Content gap analysis |
|---|---|---|---|---|---|
| Promptwatch | Yes (10 models) | Yes (page-level) | Yes (snippet/GSC/logs) | Yes (heatmaps) | Yes (built-in) |
| Profound | Yes | Yes | Limited | Yes | Limited |
| AthenaHQ | Yes | Yes | No | Yes | No |
| Otterly.AI | Yes | Basic | No | Basic | No |
| Peec AI | Yes | Basic | No | Basic | No |
| Rankshift | Yes | Yes | No | Yes | No |
| LLM Clicks | No | Yes | Yes | No | No |
| Scrunch AI | Yes | Yes | No | Yes | No |
The pattern is clear: most tools handle one or two layers well. If you want all four in one place without stitching together multiple subscriptions, a unified platform is the more practical choice.
Getting started this week
If you're starting from scratch, here's a practical first week:
On day one, define your prompt set. Aim for 30-50 prompts covering category discovery, comparison, and problem-aware queries. Don't overthink it -- you'll refine as you go.
On day two, run those prompts manually across ChatGPT, Perplexity, and Google AI Overviews. Record your brand's appearance rate. This is your baseline.
On day three, check Google Search Console for AI Overview data. Look at your server logs or analytics for sessions from perplexity.ai, chat.openai.com, and similar referrers. Estimate your current AI-attributed traffic.
On day four, identify your top three competitors and run the same prompts. Note where they appear and you don't. These are your priority content gaps.
On day five, decide whether to scale this manually (spreadsheet, weekly cadence) or invest in a platform that automates the tracking and surfaces the gaps automatically.
The manual approach tells you where you stand. A platform like Promptwatch tells you where you stand and what to do about it -- which is a meaningful difference when you're trying to move the numbers, not just watch them.
AI search isn't a future concern anymore. The buyers in your category are already using it. The question is whether your dashboard can see them.