Key takeaways
- Original data works because it is the one thing a model can't synthesize from ten other pages. If your number is the source, you are the citation.
- Position still matters. Third-party studies put roughly 38% of AI Overview citations in the organic top 10, so pair your data with solid classic SEO.
- Put the stat early. CXL's 100-citation sample found 55% of cited passages in the first 30% of the page.
- Package data for extraction: a one-sentence finding, a clean table, a stated method and date, then deeper analysis below.
- Measure citations, not just rankings. Track the exact prompts and queries where your stat should appear, and refresh the data on a schedule.
Why original data is the best citation bait
Most content aimed at AI Overviews is a remix. Ten pages say roughly the same thing about "how to reduce churn", and the model picks a few. When your page contains a figure that exists nowhere else, such as "median onboarding time across 4,200 customers was 11 days", the model has a reason to cite you specifically. It can't get that sentence from a competitor.
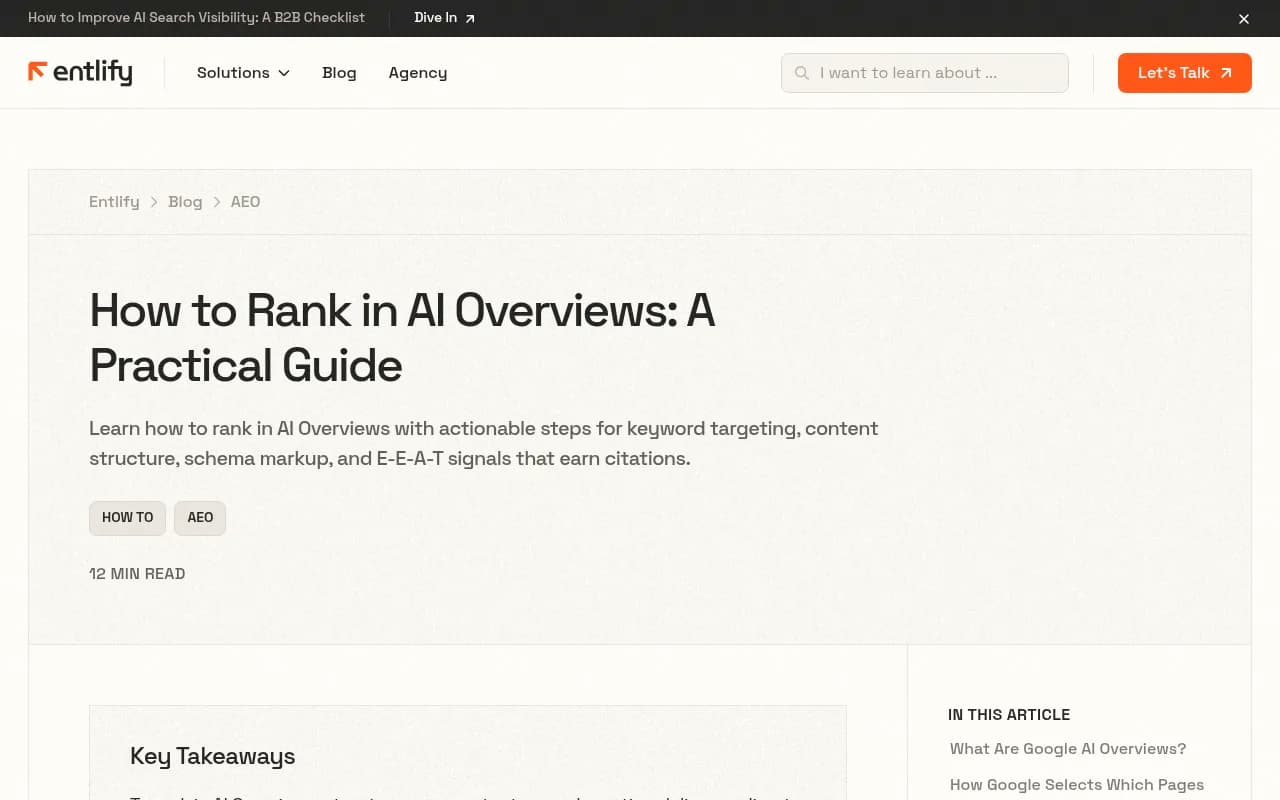
The Entlify guide makes a similar point: a niche SaaS blog with original benchmarks on cloud security tends to beat a generic high-authority site publishing surface-level overviews. I agree with the direction, though I'd soften "every time". Authority and ranking still count. Original data tilts the odds. It doesn't guarantee anything.
There is also a business reason. Ahrefs data cited by CXL says AI Overviews have cut clicks to top-ranking content by up to 58%, and Pew found that traditional results get clicked 8% of the time when an AI Overview appears versus 15% without one. Fewer clicks means being named inside the answer matters more. A cited stat with your brand attached is visibility you can still win.
What "ranking" in an AI Overview actually means
There is no position one. Ranking in an AI Overview means your URL appears among the sources linked beside or below the generated answer. Those citations are not permanent. They shift as Google re-runs retrieval, and a page cited on Monday can vanish by Friday.
AI Overviews also don't just pull from the top results for your exact query. The process breaks one search into hidden sub-questions and retrieves sources for each, which is why a page ranking on page two can still get cited if it answers one sub-question better. Original data is good at this. A specific statistic is a clean answer to a narrow sub-question.
How tightly rankings and citations are linked
The evidence is mixed, and it is worth being honest about that:
| Source | Finding |
|---|---|
| Ahrefs (July 2025, via Customer Impact) | 76% of cited pages sat in Google's top 10 across 1.9M citations |
| Ahrefs 2026 analysis (via CXL) | 37.1% of cited URLs also ranked top 10 for the same query |
| Originality.AI (via Customer Impact) | Position 1 has a 57.9% chance of an AI citation; top 10 about 38.1% |
The numbers disagree because the studies measure different things and different query sets. The takeaway is consistent: ranking helps, but it's moderate, not decisive. So treat original data as a way to be eligible through the side door, not as a replacement for ranking well.
What counts as original data
You don't need a research department. Four sources cover most teams:
- First-party product data, such as aggregated and anonymized usage, benchmarks, or time-to-value figures.
- Surveys of your customers or audience, even 200 to 300 responses if the method is clear.
- Analysis of public data that nobody has bothered to clean up, like pricing across 500 competitors or job postings over a year.
- Experiments you ran on your own site, with the before and after numbers.
What doesn't count: a roundup of other people's statistics. That's a listicle with citations, and it competes with every other listicle. Listicles are still the biggest single format in Google's answers. Promptwatch Data's July 2026 report on AI Overviews citation types puts listicles at 18.0% of citations, ahead of product pages at 16.3% and how-tos at 15.1%. But listicles lost the top spot in late July, when product pages took over every day from July 28. Format mix is shifting toward brand-owned pages, and a data page with specs and numbers sits closer to that side than a generic roundup does.
One caveat. None of the Promptwatch reports I reviewed measure "original research" as its own content type, so I can't give you a clean citation-share figure for data studies. Anyone who quotes you one is probably guessing.
Step 1: Pick a question people actually ask
Data nobody searches for earns nothing. Start from questions where an AI answer already appears and where a number would make the answer better.
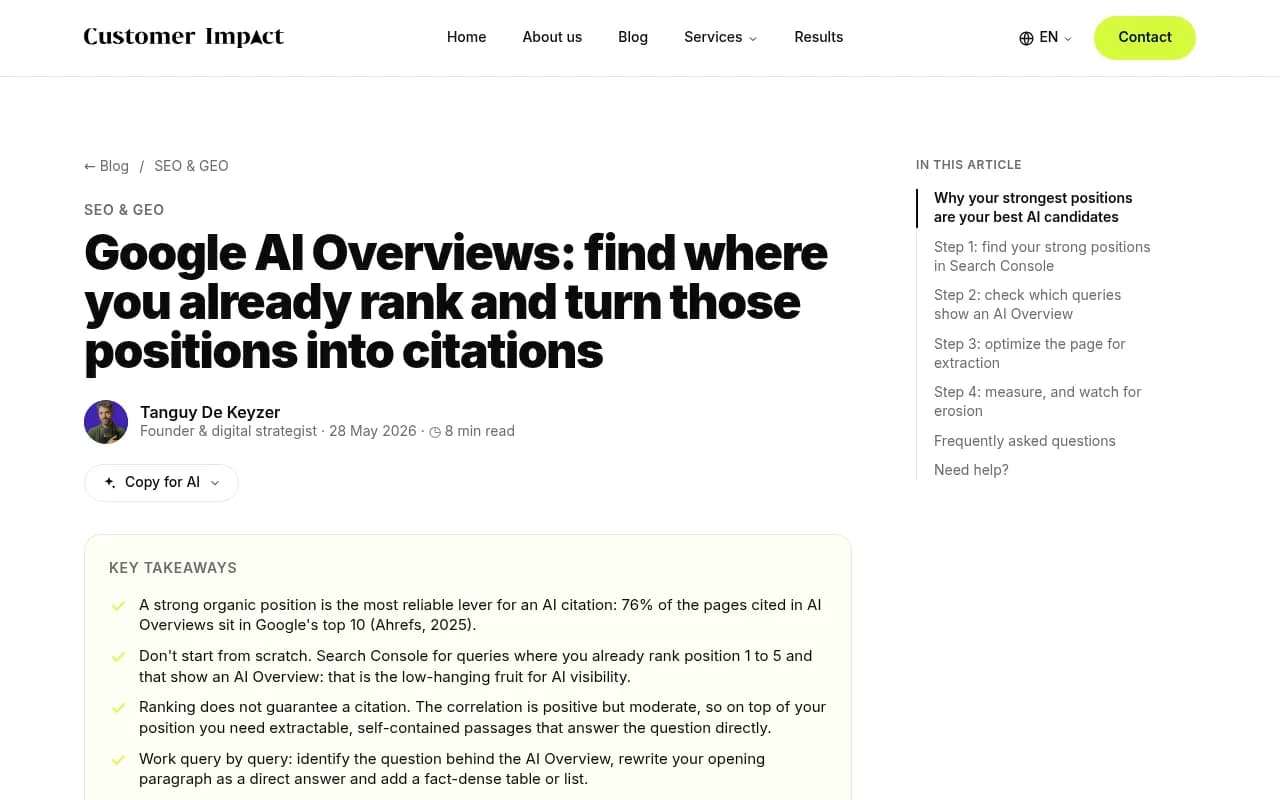
- Pull queries where you rank in the top 10 and an AI Overview shows. Customer Impact's advice to start from existing strong positions is sensible, since those pages are your most likely candidates.
- Look for answers that are vague. "It depends" and "typically between X and Y" signal a gap your data can fill.
- Mine forums for phrasing. Reddit was 2.72% of AI Overview citations in Promptwatch Data's June 2026 AI Overview citation share report (month-to-date, so treat it as directional), and the threads show how real prospects word their questions.
- Write the headline finding as a sentence before you collect anything. If you can't imagine the sentence being quoted, pick a different question.
Step 2: Collect data you can defend
AI systems don't verify your methodology, but readers, journalists, and Google's quality systems do. Keep the basics clean:
- State the sample size, date range, and how you selected the data.
- Say what the data can't tell you. A one-line limitation builds more trust than a confident overreach.
- Keep the raw table. You'll want it for the page and for anyone who asks.
- Date it. Freshness is a retrieval signal, and Entlify suggests a roughly 90-day update cycle for competitive topics.
A spreadsheet or Airtable base is plenty for most studies.
If you're working from public sources at scale, scraping and cleaning is the slow part, and an automation tool like n8n can run it on a schedule so the dataset refreshes without a manual rebuild.
Step 3: Structure the page for extraction
This is where most data studies lose. They bury the finding under a long intro and a methodology section.
Lead with the finding
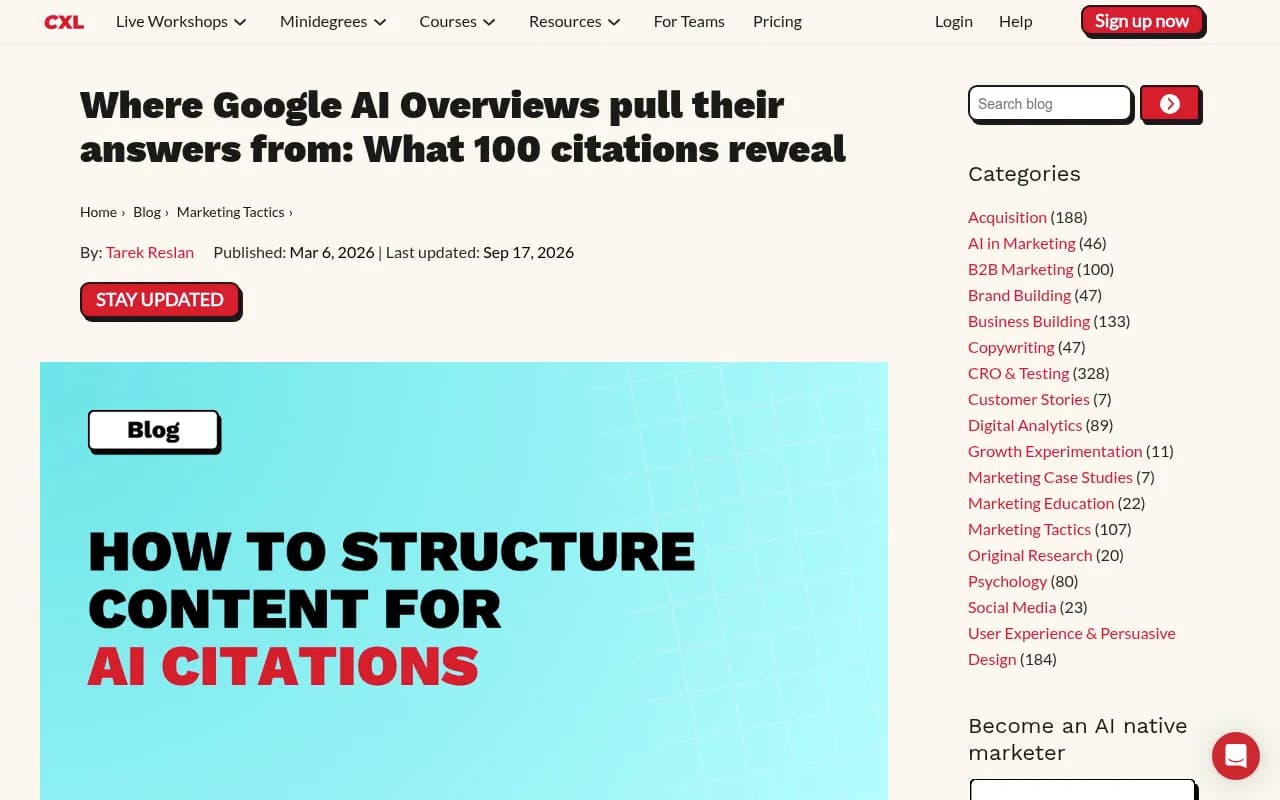
CXL analyzed 100 AI Overview citations and found 55% of cited passages in the first 30% of the source page. The top 20% of pages accounted for 48 of 100 citations. Kevin Indig saw a similar front-loaded pattern in 18,012 ChatGPT citations (44.2% from the first 30% of a document). CXL itself cautions that placement is a retrieval consideration, not a guaranteed ranking factor, and Google says there are no special technical requirements. Still, it costs you nothing to put the answer first.
A pattern that works:
- A one- or two-sentence finding with the number, sample, and date.
- A table or chart with the core breakdown, in real HTML text, not just an image.
- Three to five sub-findings, each under its own question-style heading with a direct answer in the first two sentences.
- Methodology and limitations.
- Downloadable data, if you can share it.
Write the stat so it survives being lifted out
A sentence that gets extracted has to make sense alone. Compare:
- Weak: "Our results were surprising."
- Strong: "In a Q3 2026 analysis of 4,200 B2B onboarding flows, the median time to first value was 11 days."
The strong version carries its own context: what, how many, when. Name your brand in the sentence or the immediately surrounding text so the citation carries attribution.
Add structure Google can parse
Validated schema (Article, Dataset where it fits) and clean headings won't make a citation happen, but they remove reasons for a model to skip you. Check crawlability and Core Web Vitals too. A crawler like Screaming Frog is useful for confirming the page isn't blocked, orphaned, or buried.
Step 4: Make the data page earn its place
Publishing is half of it. A data page that nobody links to or mentions is easy to ignore.
- Link to it from your related product pages and guides. Product pages are the fastest-growing cited format, so connecting data to them gives both more weight.
- Pitch the headline number to trade press and newsletters in your niche. Third-party pages that repeat your stat, with attribution, reinforce the claim.
- Turn one dataset into several assets: a summary page, a chart set, a short video. Video grew from about 2.7% of AI Overview citations in January to over 6% by late July 2026 in the same Promptwatch report, and most brands still have no video competing for those slots. A tool like Descript makes a quick data walkthrough realistic for a small team.
- Keep it alive. News-style pages decay fast. Promptwatch Data's half-life report found that ChatGPT-cited news pages lost half their citations within about 36 days, while landing pages and docs stayed cited for months. That's ChatGPT data, not AI Overviews, but the logic carries. Build your data page as a durable, updated resource at a stable URL, not a one-off news post.
If you want outside help with the digital PR side of promoting a study, agencies such as 1001 SEO Media run link-building and AI search programs that include this kind of data-led outreach.
Step 5: Track whether the data gets cited
Rankings won't tell you if you're in the overview. You need to check the specific prompts and queries tied to your data, across locations and over time, because citations come and go.
Start manually: search your target queries, note whether an AI Overview appears, and record whether your URL is in the sources. That works for ten queries. It breaks at a hundred.
After that, a tracker helps. Promptwatch monitors Google AI Overviews and AI Mode alongside ChatGPT, Perplexity and others from the real interfaces, and shows which of your pages get cited and which prompts you're missing. Its page tracking and content gap analysis are useful for seeing whether your data page is picked up for the sub-questions you wrote it for.
Other tools that cover AI Overviews specifically include Knowatoa, Finseo and Thruuu.
For wider options, the GEO software directory at bestgeosoftware.com lists far more trackers than I can fairly cover here.
Tool comparison
| Job | Tool types | Examples |
|---|---|---|
| Store and clean the dataset | Spreadsheet or database | Airtable |
| Automate data collection | Workflow automation | n8n |
| Check crawlability | Site crawler | Screaming Frog |
| Track AI Overview citations | AI visibility tracker | Promptwatch, Knowatoa, Finseo |
| Produce video summaries | Video editor | Descript |
Reading the results
Give it a few weeks, then ask three questions.
- Is the page indexed and ranking for its target query? If not, fix classic SEO first.
- Is an AI Overview showing for that query, and are you in it? If it shows without you, compare your opening paragraph to what the overview says. Is your number actually answering the question?
- Are competitors citing your stat without linking? That is a signal your data traveled, and it's worth chasing a proper citation.
Expect noise. Google's citations rotate, and Promptwatch notes that month-to-date figures can overstate momentum. Judge trends over weeks, not days.
Common mistakes
- Publishing a PDF only. A model can't cite what it can't easily read. Put the findings in HTML.
- Burying the lead under 600 words of context.
- Vague claims like "most companies" with no sample. If you can't state n, don't state the stat.
- Never updating. A 2024 benchmark in late 2026 reads as stale, to people and to retrieval systems.
- Ignoring ranking. Original data on a page that Google barely indexes goes nowhere.
A simple 30-day plan
- Week 1: choose a question from queries where you already rank and an AI Overview appears. Write the headline sentence you hope to earn.
- Week 2: collect and clean the data. Write the limitations.
- Week 3: build the page with the finding first, a table, question-style sub-sections, and schema. Link it from related pages.
- Week 4: publish, pitch, and set up tracking for the target queries. Schedule a refresh in 90 days.
The unglamorous truth is that original data is slow and sometimes embarrassing, because the numbers may not say what you hoped. That's also why it works. It's hard to copy, and it gives the model a reason to name you.