Key takeaways
- Traditional SEO metrics like rankings and organic traffic don't capture whether your brand appears in AI-generated answers from ChatGPT, Perplexity, Claude, or Google AI Overviews.
- The four core AI visibility KPIs are Citation Presence, Reuse Rate, Recommendation Rate, and AI Share of Voice -- each measuring a different layer of how AI engines select and present your brand.
- Weekly tracking matters because AI models update their knowledge and citation patterns frequently; monthly reporting hides the signal.
- Most monitoring tools show you data but stop there. The teams making real progress are the ones closing the loop: find gaps, create content, track improvement.
- A good AI visibility dashboard doesn't need to be complex -- it needs to answer three questions: Are we being cited? Are we being recommended? Are we winning against competitors?
Why your current dashboard is lying to you
Here's a scenario that's playing out in marketing teams everywhere right now. Organic traffic looks stable. Rankings are holding. The monthly report goes to the board with a green arrow. Meanwhile, a competitor is getting recommended by ChatGPT every time someone asks which product to buy in your category. You have no idea.
That's the measurement gap in 2026. Traditional SEO metrics were built to answer "where do we rank in a list of blue links?" AI search doesn't work that way. When someone asks ChatGPT or Perplexity a buying question, the model synthesizes an answer from its training data and indexed sources. Your brand either makes it into that answer or it doesn't. Ranking position has almost nothing to do with it.
The question has shifted from "where do we rank?" to "are we included, understood, and selected?" Those are three distinct problems, and they need three distinct metrics.
This guide walks through exactly how to build a weekly AI visibility tracking dashboard -- what to measure, how to structure it, and which tools to use for each layer.
The four KPIs that actually matter
Credit to Cassie Clark's AI Visibility Measurement Framework here, which maps KPIs to the FSA model (Freshness, Structure, Authority). It's the clearest framework I've seen for turning AI visibility into something trackable.
Citation presence (freshness)
The most basic question: does your brand show up in AI responses at all?
Citation presence measures what percentage of relevant prompts return a response that includes your brand as a cited source. Not just a mention -- an actual citation with a link back to your content.
This is your freshness signal. AI models prefer recently updated, actively crawled content. If your citation presence is low, it usually means one of two things: your content isn't being crawled by AI bots, or it exists but isn't structured in a way that makes it easy to cite.
Track this weekly across a consistent set of prompts. A 5-10% week-over-week improvement after publishing new content is a good signal that the content is working.
Reuse rate (structure)
Citation presence tells you if you're in the answer. Reuse rate tells you if AI models keep coming back to the same pages.
When a specific URL gets cited repeatedly across multiple prompts and multiple AI models, that's a structural signal. The page is formatted, organized, and written in a way that AI engines find easy to extract and reference. High reuse rate pages are your best-performing AI assets.
Track this at the page level. You want to know which pages are pulling their weight and which ones are invisible despite getting traditional SEO traffic. The gap between those two lists is often surprising.
Recommendation rate (structure + authority)
This is where it gets commercially interesting. Recommendation rate measures how often your brand gets actively recommended -- not just cited as a source, but named as a solution or product the user should consider.
There's a meaningful difference between "Brand X published a study on this topic" (citation) and "Brand X is one of the best options for this use case" (recommendation). The second one is what drives pipeline.
Recommendation rate tends to be lower than citation presence, and that's fine. But you want to see it moving in the right direction week over week, especially for high-intent prompts like "best [category] tool" or "what should I use for [problem]."
AI share of voice (authority)
Share of voice is the competitive metric. Out of all the AI responses generated for your tracked prompt set, what percentage include your brand versus competitors?
This is the number that belongs in the board deck. It's intuitive, comparable over time, and directly tied to competitive position. A brand with 40% AI share of voice in its category is winning the AI search channel. A brand at 8% has a problem.
Track this per AI model too, not just in aggregate. You might have strong share of voice in Perplexity but be nearly invisible in ChatGPT. Those are different problems with different fixes.
Building your weekly tracking dashboard
The goal isn't a complex dashboard with 40 metrics. It's a simple one that your team actually looks at every Monday morning and knows what to do with.
Here's the structure that works:
Layer 1: Visibility scorecard (weekly snapshot)
| Metric | This week | Last week | 4-week trend |
|---|---|---|---|
| Citation presence % | -- | -- | -- |
| Recommendation rate % | -- | -- | -- |
| AI share of voice % | -- | -- | -- |
| Pages with active citations | -- | -- | -- |
| New citations this week | -- | -- | -- |
Keep this to one screen. The job of this layer is to answer "are we moving in the right direction?" in 30 seconds.
Layer 2: Prompt-level breakdown
Behind the scorecard, you need visibility at the prompt level. Which specific queries are you winning? Which ones are you losing? Which ones did you gain or lose this week?
This is where you diagnose. If your overall share of voice dropped, the prompt-level view tells you whether it's one category of queries or spread across everything. That determines whether you need new content or a different optimization approach.
Prioritize prompts by commercial intent. A prompt like "best project management software for remote teams" matters more than "what is project management." Track both, but weight your attention toward the ones that map to actual buying decisions.
Layer 3: Competitor heatmap
Once a week, look at the side-by-side comparison. For each prompt cluster, who's winning -- you or a competitor? Which competitors are gaining ground? Are there prompts where nobody dominates, which means there's an open opportunity?
The heatmap view is what turns monitoring into strategy. You're not just watching your own numbers; you're understanding the competitive landscape and finding the gaps worth targeting.
Layer 4: Content-to-citation attribution
This is the layer most teams skip, and it's the one that closes the loop. When you publish a new article or update an existing page, you need to know whether it actually improved your citation rate for the prompts it was targeting.
Without this, you're publishing content and hoping. With it, you're running a repeatable system: publish, wait 2-3 weeks, check citation lift, iterate.
The tool stack for this dashboard
You can't build this dashboard manually at any meaningful scale. Running 50+ prompts across 5 AI models every week by hand would take a full-time person. You need a platform that automates the data collection and surfaces the insights.
Here's how the main options compare:
| Tool | Citation tracking | Share of voice | Content gap analysis | AI content generation | Crawler logs |
|---|---|---|---|---|---|
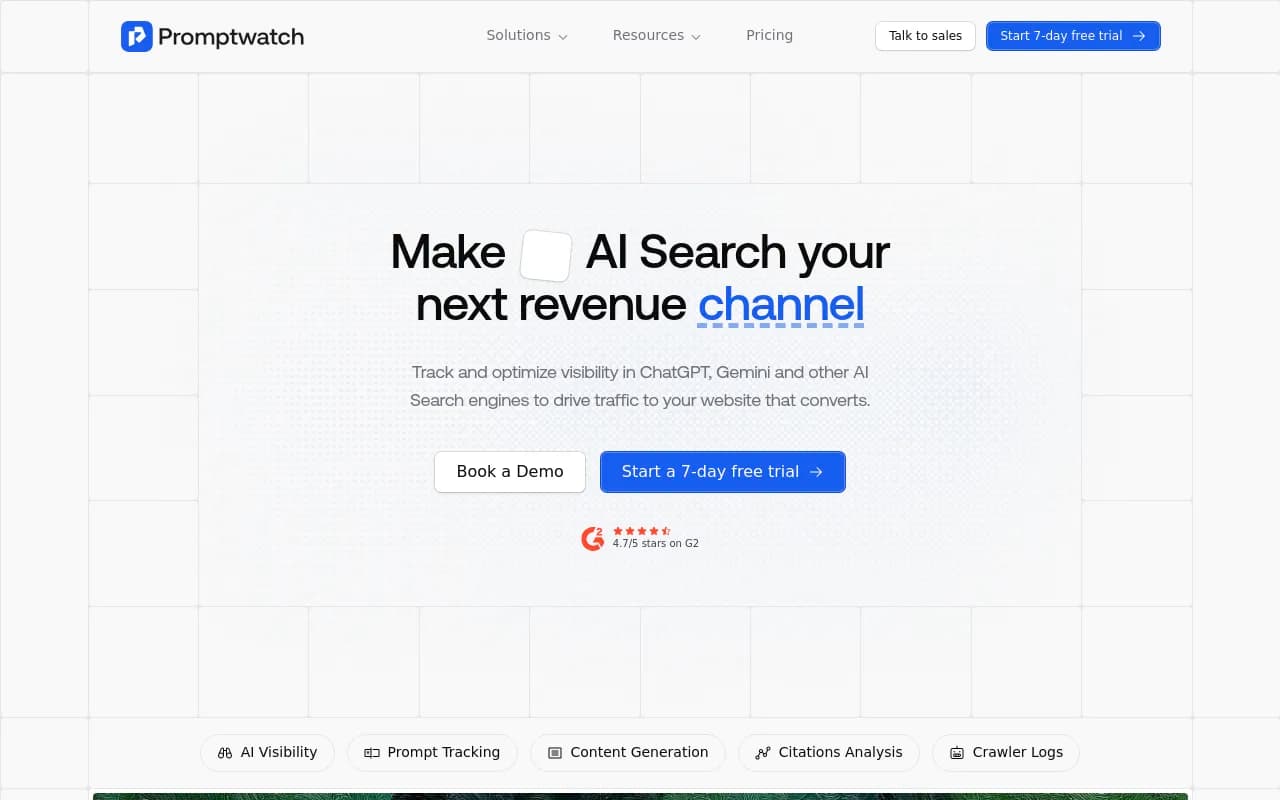
| Promptwatch | Yes | Yes | Yes | Yes | Yes |
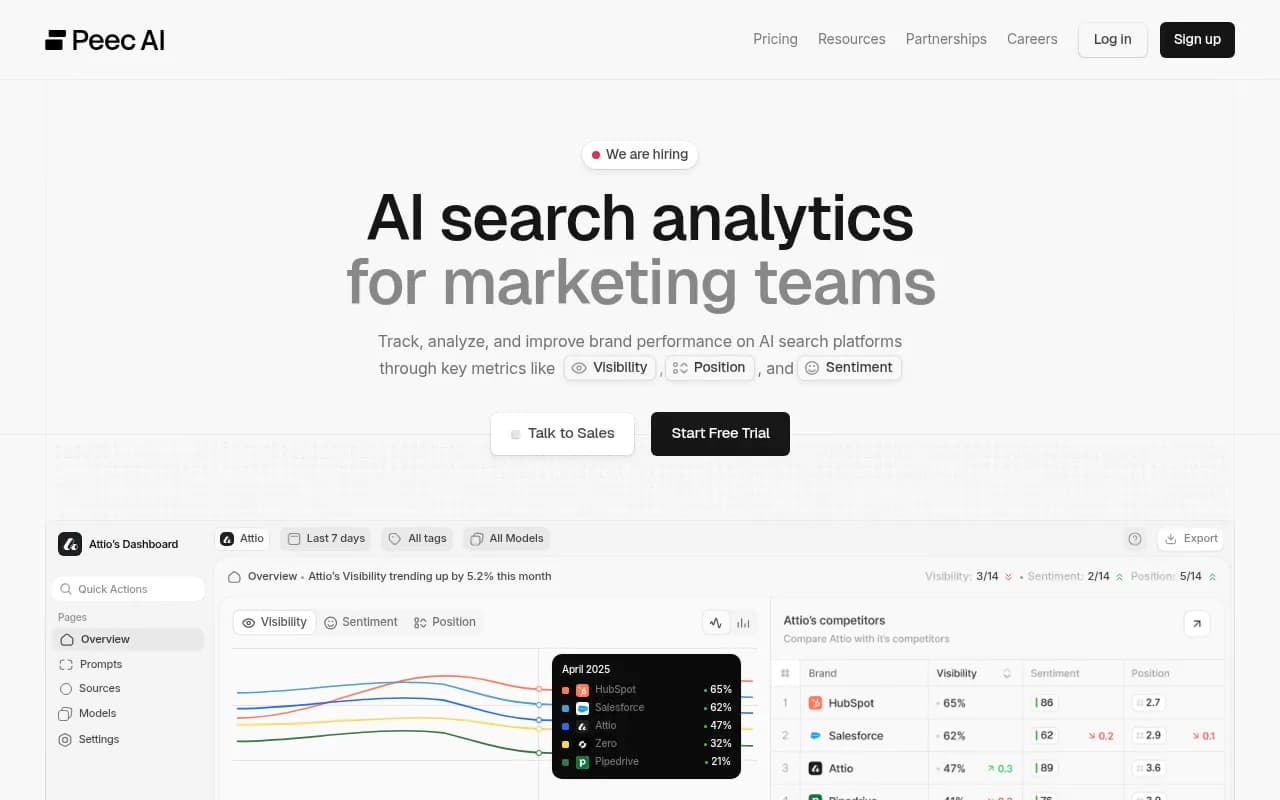
| Peec AI | Yes | Yes | No | No | No |
| Otterly.AI | Yes | Yes | No | No | No |
| AthenaHQ | Yes | Yes | No | No | No |
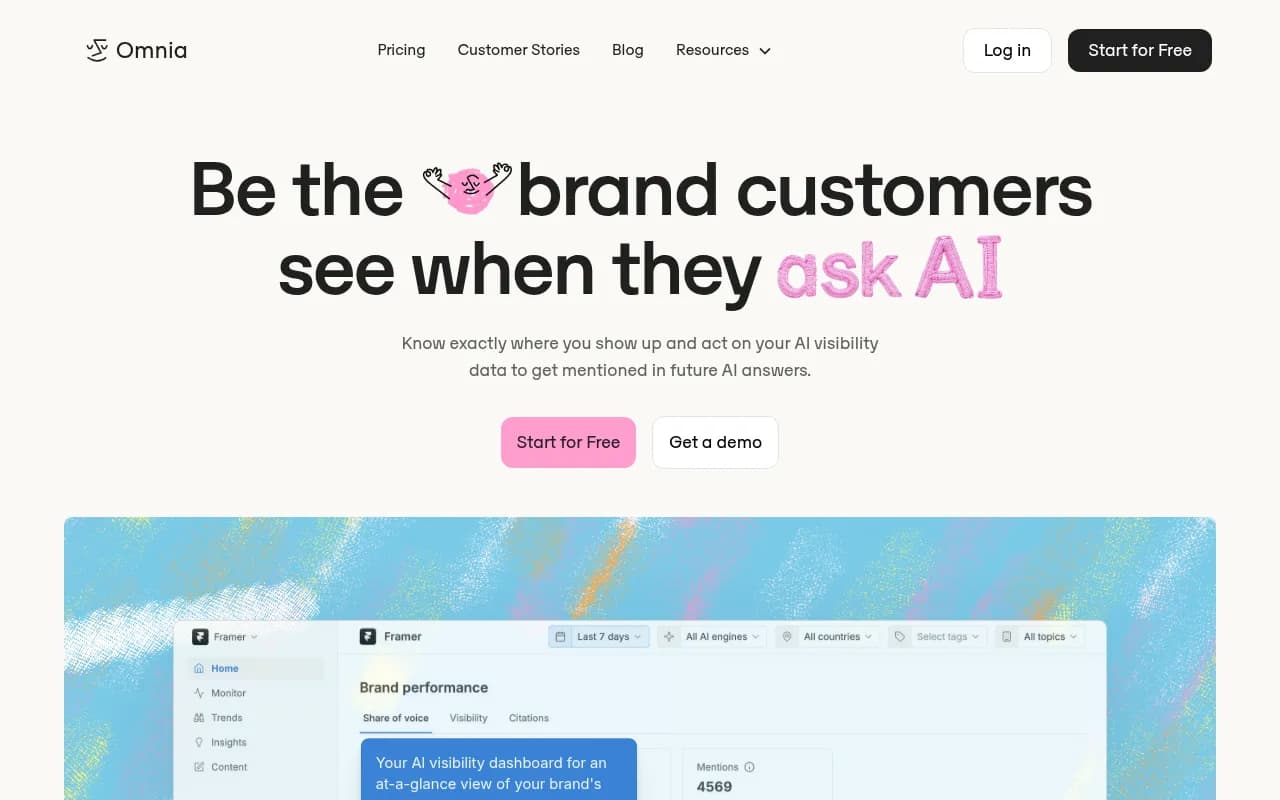
| Omnia | Yes | Yes | No | No | No |
| Profound | Yes | Yes | Limited | No | No |
The core difference worth understanding: most tools in this space are monitoring dashboards. They show you the data from layers 1-3 above. Promptwatch is the one that also handles layer 4 -- the content-to-citation loop. It has a built-in answer gap analysis that shows which prompts competitors rank for that you don't, and an AI writing agent that generates content specifically engineered to get cited.
For teams that just want monitoring data to feed into their own workflow, Peec AI and Omnia are solid options.
For enterprise teams with complex reporting needs, Profound and AthenaHQ have strong feature sets, though both come at higher price points and neither covers the content creation side.
Setting up your prompt set (the step most teams get wrong)
Your tracking is only as good as your prompt set. If you're monitoring the wrong queries, the data is useless regardless of how good your dashboard looks.
A few principles that actually work:
Start with buyer language, not category language. "Best CRM for small business" is a real buyer prompt. "Customer relationship management software" is a category term. AI models respond very differently to these, and buyers use the first type.
Build prompt clusters, not individual prompts. One buying decision generates dozens of related queries. "Best email marketing tool," "email marketing software comparison," "what email platform does [competitor] use" -- these are all part of the same cluster. Track the cluster, not just one prompt.
Include competitor-adjacent prompts. Prompts like "alternatives to [competitor]" or "[competitor] vs [your brand]" are high-intent and often overlooked. If you're not tracking these, you're missing some of the most commercially valuable AI real estate.
Prioritize winnable prompts. If a competitor has 90% share of voice on a prompt and has been cited thousands of times, that's a hard battle. Look for prompts where the field is more open -- where the current top-cited source is a generic blog post or a Reddit thread. Those are the gaps worth targeting first.
The weekly review process
Data without a review process is just noise. Here's a simple weekly rhythm that keeps the dashboard useful:
Monday (15 minutes): Scorecard review. Look at the four core KPIs. Are they up or down from last week? Flag anything that moved more than 5% in either direction for investigation.
Tuesday (30 minutes): Prompt-level diagnosis. For any KPIs that moved significantly, drill into the prompt level to understand why. Did a competitor publish something new? Did one of your pages drop out of citations? Did a new content piece start getting picked up?
Wednesday (ongoing): Content action. Based on Tuesday's diagnosis, either brief new content to address gaps or update existing pages that have dropped in citation rate. This is the step that separates teams that improve from teams that just watch.
Friday (10 minutes): Citation log check. Review which AI crawlers visited your site this week, which pages they read, and whether there were any crawl errors. This is a lower-level signal but it's useful for catching technical issues early.
The metrics that connect to revenue
One honest caveat: citation presence and share of voice are leading indicators, not revenue metrics. The board will eventually ask "so what does this mean for pipeline?"
There are two ways to connect AI visibility to revenue:
AI-attributed traffic. When someone discovers your brand through an AI response and then visits your site, that visit often shows up as direct traffic or branded search in Google Analytics. The attribution is broken by default. Fixing it requires either a tracking snippet on your site, a Google Search Console integration, or server log analysis to identify AI referral patterns. Platforms like Promptwatch offer all three methods.
Assisted conversion tracking. Even if you can't perfectly attribute the first touch, you can track whether branded search volume and direct traffic are growing in correlation with AI visibility improvements. It's not perfect attribution, but it's a reasonable proxy.
The Peec AI blog makes a useful point here: traffic from LLMs is systematically underreported because when someone discovers your brand through ChatGPT, they often Google you next or type your URL directly. Google Analytics credits Google organic or direct -- not the AI. So your AI visibility impact is almost certainly larger than your analytics suggest.
Common mistakes to avoid
Tracking too many prompts too soon. Start with 20-30 high-intent prompts and track them consistently for 4-6 weeks before expanding. A small, consistent prompt set gives you cleaner trend data than a large, changing one.
Ignoring model-level differences. Your brand might have 35% share of voice in Perplexity and 12% in ChatGPT. Treating these as one number hides the insight. Track by model, especially for the models your audience actually uses.
Optimizing for citations without checking sentiment. A citation that says "Brand X has faced criticism for..." is worse than no citation. Track how AI models describe your brand, not just whether they mention it.
Publishing content and forgetting to check the loop. The most common failure mode is publishing AI-optimized content and never verifying whether it actually improved citation rates. Set a calendar reminder for 3 weeks after any major content publish to check the prompt-level data.
Reporting on AI visibility in isolation. Connect it to the broader marketing picture. If AI share of voice is growing but branded search is flat, something is off. If both are growing together, you have a real signal.
What a mature AI visibility program looks like
After 6-12 months of consistent tracking and optimization, the teams doing this well have a few things in common:
They know exactly which pages are their AI citation anchors -- the 10-20 pages that generate the majority of their citations across all models. They protect and update these pages religiously.
They have a content pipeline that's driven by answer gap analysis, not editorial intuition. Every piece of content they publish is targeting a specific set of prompts where they're currently losing to competitors.
They can show the board a clear trend line: AI share of voice up X% over the past quarter, correlated with Y% growth in branded search and Z% growth in direct traffic.
And they're tracking across all the models that matter -- not just ChatGPT, but Perplexity, Claude, Gemini, Google AI Overviews, and increasingly Grok and DeepSeek as those gain share.
The teams that aren't doing this yet are flying blind in a channel that's already influencing a significant portion of their buyers' decisions. The good news is the measurement infrastructure exists now. You don't have to guess.