Key takeaways
- AI Overview share of voice is the percentage of tracked-prompt answers where your brand is mentioned or cited, divided by all brand appearances (yours plus competitors') for the same prompts.
- Pick one denominator and stick with it. Different guides use different formulas, and they give different numbers for the same data.
- Report AI Overviews separately from ChatGPT and Perplexity. Citation slots, source mixes and behavior differ too much to pool.
- AI Overviews citations go heavily to platform domains like YouTube, Reddit and google.com, so your SOV competes with platforms as well as rival brands.
- Benchmarks you see online are mostly heuristics. Trend lines against your own named competitors matter more than any universal number.
What AI Overview share of voice actually measures
Share of voice in classic SEO was built on keyword rankings and impressions. In AI Overviews there is no position 1 to track. There is a synthesized answer, and your brand is either named in it, cited as a source, or absent.
So AI Overview SOV answers one question: of all the brand appearances across a defined set of prompts, what fraction belong to you? Everything else in this guide is about making that number honest.
It helps to separate four terms that get blurred together:
| Term | What it is | Example |
|---|---|---|
| Mention | Your brand name appears in the answer text | An AI Overview lists you among five CRM tools |
| Citation | Your URL appears in the source list | Your pricing page is linked as a source |
| Recommendation | The answer actively suggests you | "Best for small teams: YourBrand" |
| Share of voice | Your appearances relative to everyone's | 18% of all brand appearances on tracked prompts |
A brand can be cited without being mentioned, and mentioned without being cited. Treat them as two signals and report both. Conductor, for example, splits SOV into mention-based and citation-based variants, which is a sensible way to do it.
Why AI Overviews deserve their own SOV number
It is tempting to run prompts across every AI engine, add everything up and call it "AI SOV." Don't. Promptwatch Data shows why.
First, citation slots differ. According to Promptwatch's average sources per response data (a snapshot from September 2025, so figures drift), Google AI Overviews and Perplexity cite about 10 sources per answer, while ChatGPT cites about 5 on web-search answers. A citation in ChatGPT is a scarcer thing than a citation in an AI Overview. Pooling them overweights the engine with more slots.
Second, the source mix is different. In Promptwatch's social media citations data for Sep 28 to Oct 4, 2026, social platforms made up 12.2% of AI Overviews citations, roughly 26 times ChatGPT's share (0.46%). YouTube alone was 4.28% of AI Overviews citations, with Facebook at 2.38%, Reddit at 2.15%, Instagram at 1.61% and LinkedIn at 1.55%.
Third, Google cites itself. The Google AI Overview citation share report for June 2026 (May 31 to Jun 26, month-to-date) found YouTube at 4.16%, Reddit at 2.72% and google.com at 2.30% of all AI Overview citations. The google.com share doubled from 1.15% in May and was 0.37% in January. Treat partial-month figures with care, since they can overstate momentum for fast risers, but the direction is clear: a chunk of every AI Overview goes to platforms, not brands.
The practical consequence: your brand's SOV in AI Overviews is a fight over a pie that is already partly eaten by YouTube, Reddit and Google. A 12% share there may be a better result than a 12% share elsewhere.
How to calculate AI Overview share of voice, step by step
Step 1: Build the prompt set
Aim for 25 to 50 prompts, since fewer than that makes the percentages jumpy. Split them across three clusters:
- Brand prompts: "What is [brand]?" and "Is [brand] worth it?"
- Category prompts: "Best [category] for [use case]"
- Comparison prompts: "[Brand] vs [competitor]"
Write them the way people actually talk to an AI. Six to ten words, conversational. Keep the set fixed between measurement periods, otherwise you are measuring your prompt changes instead of the market.
One caution: not every prompt triggers an AI Overview. Count only the prompts where an Overview actually appeared, and track the trigger rate separately.
Step 2: Define the competitive set
Pick the 3 to 10 competitors your buyers actually compare you against. Include aliases and product names, because an Overview that says "HubSpot's CRM" should still count for HubSpot. Decide upfront how you handle platforms (YouTube, Reddit, Wikipedia). I'd tag them as a separate bucket rather than dropping them, so you can see how much of the answer is not brand-owned at all.
Step 3: Collect the answers
Run each prompt in the real Google UI, from the country and language you care about, and record what the AI Overview says and cites. API results and real interface results can differ, so sample the surface your customers see. Because the answers are probabilistic, run each prompt multiple times or across several days and average the results. A single reading is an anecdote.
Step 4: Score each response
For every prompt-response, record for each brand:
- Cited: its domain appears in the source list.
- Mentioned: its name appears in the answer text.
- Recommended or first-named: optional, but useful for position-weighted SOV.
Step 5: Choose the denominator and calculate
The sources you will find online disagree here. One formula divides your appearances by the sum of competitor appearances only. Another divides brand citations by total category citations. These give different numbers.
Here is the gap in concrete terms. Say you appear 12 times and competitors collectively appear 80 times:
- You / competitors only: 12 / 80 = 15%
- You / (you + competitors): 12 / 92 = about 13%
I recommend the second, because a share should be a share of a whole. The formula:
AI Overview SOV (%) = your appearances / (your appearances + all tracked competitor appearances) x 100
Calculate it twice, once with mentions and once with citations. Then, if you want a prominence view, weight each appearance by position (first-named counts more than fifth).
Worked example
| Brand | Mentions | Citations | Mention SOV | Citation SOV |
|---|---|---|---|---|
| You | 18 | 12 | 18% | 12% |
| Competitor A | 34 | 31 | 34% | 31% |
| Competitor B | 27 | 29 | 27% | 29% |
| Competitor C | 21 | 28 | 21% | 28% |
| Total | 100 | 100 | 100% | 100% |
This brand is mentioned more often than it is cited, which usually points to a content or crawlability problem: the AI knows you exist but prefers other pages as sources. Mentions without citations is a different diagnosis from low mentions overall, which is a coverage problem.
Benchmarking against competitors
A single SOV number tells you where you stand. The comparison tells you what to do.
Benchmark at prompt level, not just overall
A competitor with 40% overall SOV may hold only 15% on the prompts closest to purchase. Break SOV out by cluster (brand, category, comparison) and by topic. The valuable output is a list of prompts where a rival appears and you do not.
Look at the source mix
Ask where the AI Overview got its answer. If rivals are cited through YouTube videos, Reddit threads or review sites while you only have your own site, the fix is off-site presence, not another blog post. Given the AI Overviews source skew above, this is the most common finding.
Rough reference ranges
You will see tables like the one below in vendor guides. They are heuristics, not measured industry data, and I could not trace a source for them. Use them as a sanity check only.
| Category type | Leader | Challenger | New entrant |
|---|---|---|---|
| Niche B2B (3-5 competitors) | 40-60% | 15-30% | 5-15% |
| Mid-market B2B (10-20 competitors) | 20-35% | 8-15% | 2-8% |
| Broad consumer (50+ competitors) | 10-20% | 3-8% | under 3% |
Context changes everything. In a two-player category, 50% means parity. In a fragmented market with ten alternatives, 15% could be leadership. Your own trend and your gap to the two or three named rivals tell you far more than these ranges.
Re-baseline regularly
Engines change behavior abruptly. Promptwatch's Reddit citation data shows reddit.com's share of ChatGPT citations falling from about 4% to 0.5% on August 14, 2026, while AI Overviews and AI Mode declined more gradually. If your SOV leaned on Reddit, a shift like that moves your number with no change on your side. Annotate your charts with engine changes and re-baseline when they happen.
Tools for tracking AI Overview SOV
Doing this by hand works for a first baseline. For ongoing tracking you want something that runs prompts daily, stores the responses and handles the arithmetic.
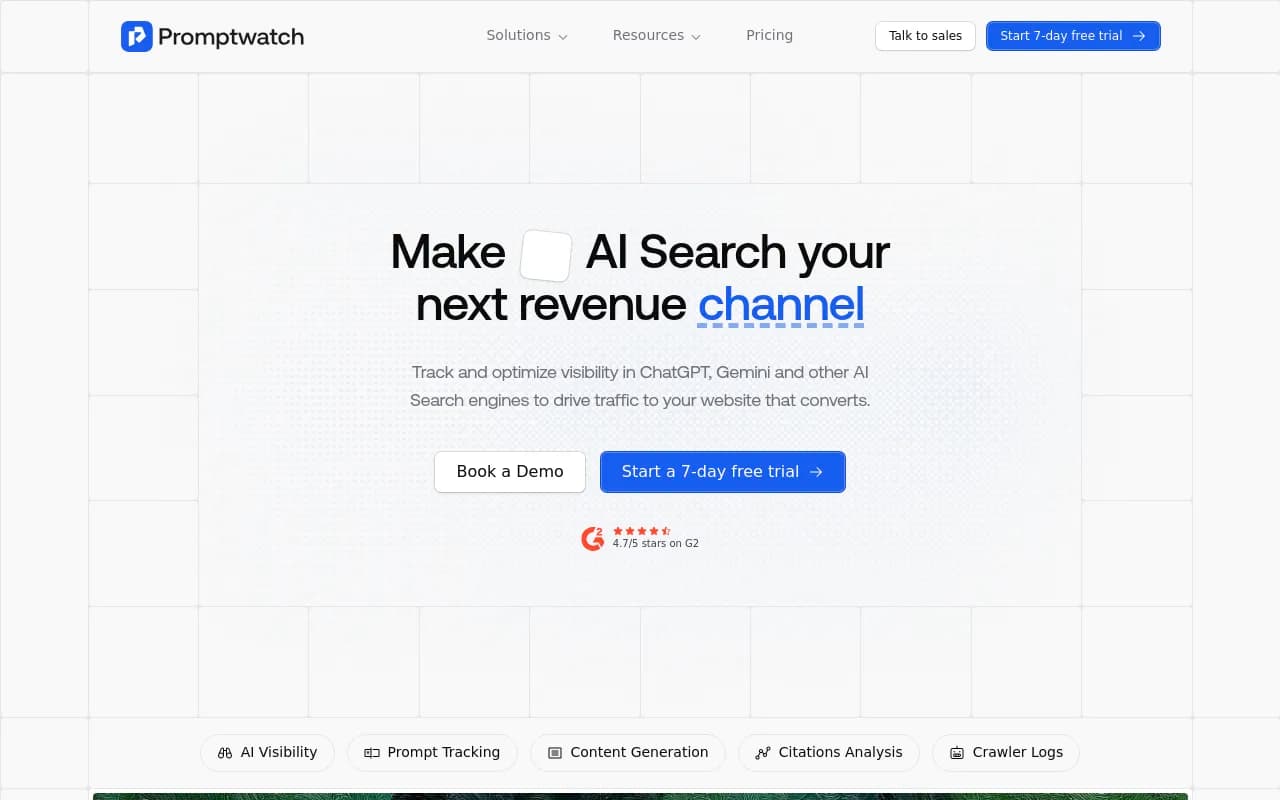
Tools like Promptwatch track Google AI Overviews and AI Mode through the real interface, by country, and report Share of Voice, visibility score and citations per engine, so you can keep AI Overviews separate from ChatGPT. It also shows which pages are being cited and has content gap analysis for the prompts where competitors win.
Other options worth a look:
Semrush's AI Visibility Toolkit calculates AI SoV from mentions and position, shows it next to competitors, and has a Missing prompts view for topic gaps. Useful if you already live in Semrush.
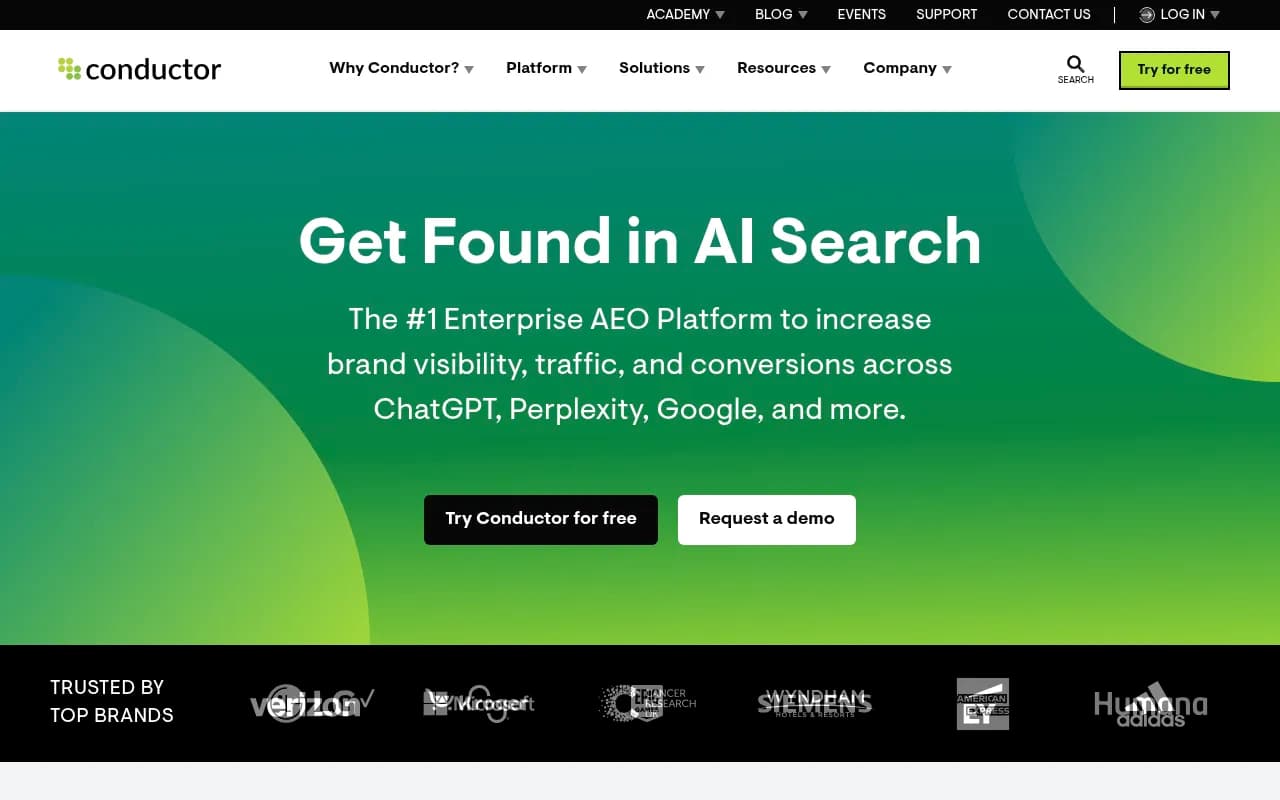
Conductor offers mention-based and citation-based SOV, with an entire-market view and a tracked-competitors view.
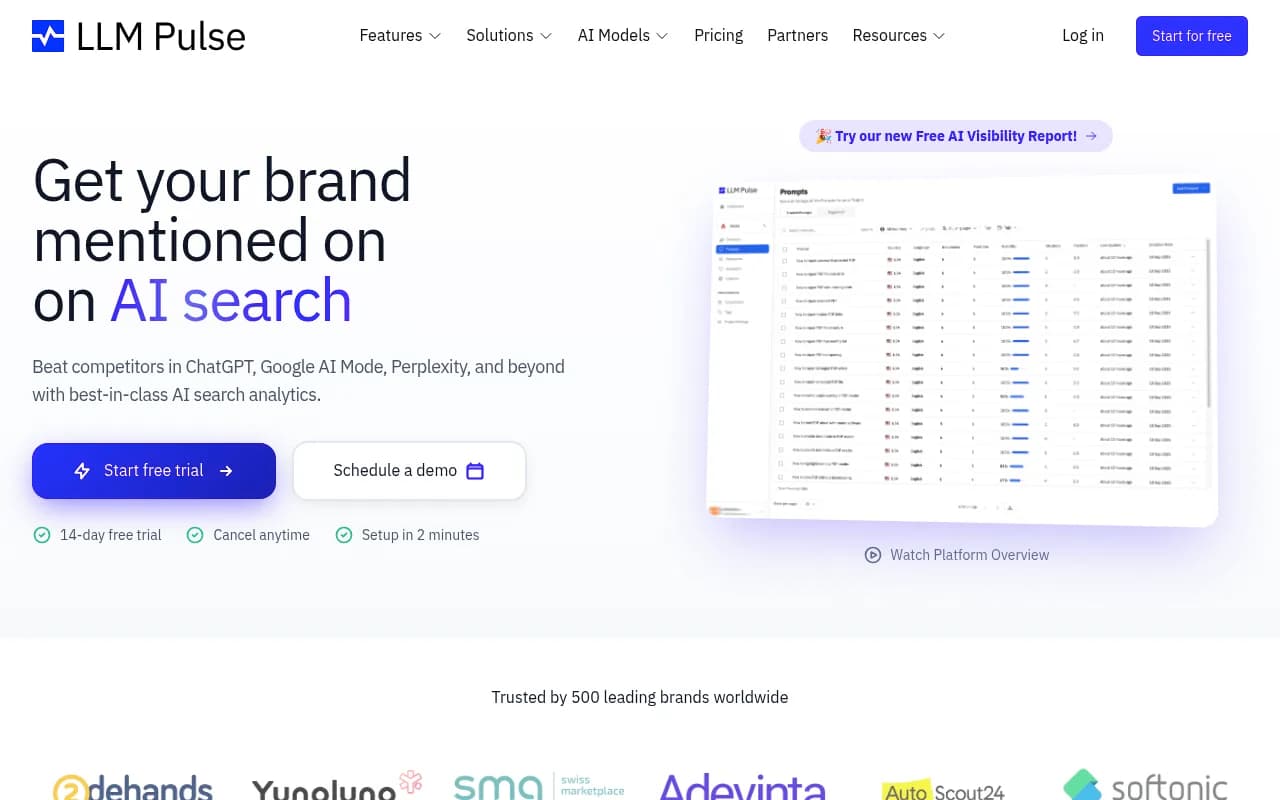
LLM Pulse breaks SOV down by AI model, prompt tag and time period.
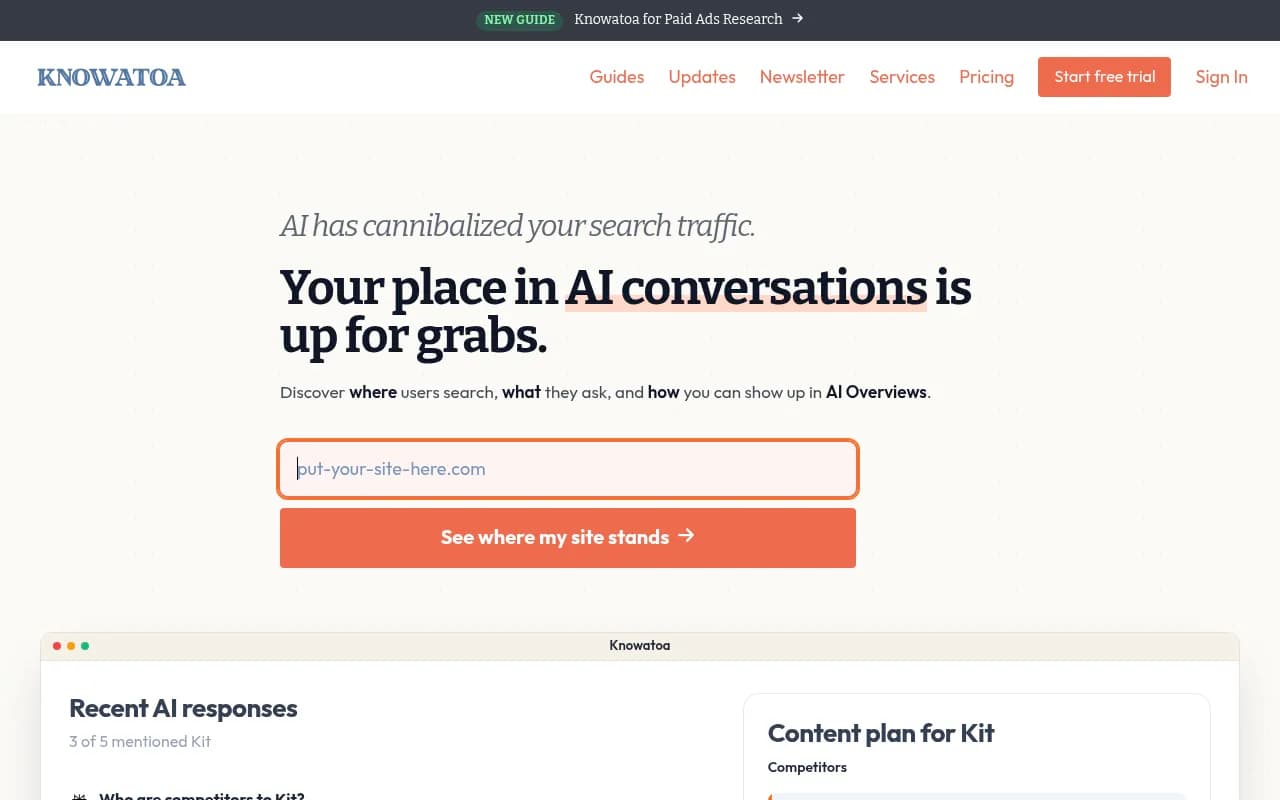
Knowatoa focuses specifically on AI Overviews and AI Mode monitoring.
Profound is a well-known enterprise option for multi-engine tracking.
| Tool | Best for | AI Overviews focus | Notes |
|---|---|---|---|
| Promptwatch | Tracking plus acting on gaps | Real-UI AI Overviews and AI Mode, per country | Also covers crawler logs and content creation |
| Semrush | Teams already in Semrush | Yes, via AI Visibility Toolkit | Position-weighted SoV |
| Conductor | Enterprise reporting | Yes | Mention vs citation SOV |
| LLM Pulse | Per-model, per-tag breakdowns | Yes | Dashboard-driven |
| Knowatoa | AI Overviews and AI Mode only | Core focus | Narrow scope |
| Profound | Large brands | Yes | Monitoring-heavy |
For wider browsing, the directory at bestgeosoftware.com lists more GEO tools by category.
What the numbers are telling you
Read the metrics together to find the real problem:
- Low SOV across most prompts: a coverage problem. You are missing from topics you should own. Build content for them.
- Decent mentions but weak citations: a source problem. Your pages are not being picked. Check crawlability, structure and whether the answer is extractable.
- Strong overall SOV but weak on comparison prompts: you own education but not decisions. Publish comparison and use-case pages.
- Appearing, but described negatively: a reputation problem. Sentiment is separate from share, and a high share with poor framing is not a win.
- Rivals cited through YouTube or Reddit: an off-site problem. You need presence where the Overview already looks.
It also helps to pair SOV with real traffic. A visibility number that never connects to visits or conversions is a vanity metric. Check referral data from AI surfaces next to your SOV trend.
Common mistakes
- Pooling every engine into one number. Citation slots and source mixes differ, so report per engine.
- Changing the prompt set mid-stream. Keep it fixed, and version it when you must change it.
- Taking one sample. Answers vary, so average repeated runs.
- Ignoring platform citations. Tag YouTube, Reddit and google.com so you know how much of the answer is not brand-owned.
- Treating third-party benchmarks as targets. The ranges above are directional. Your named competitors are the real benchmark.
- Forgetting aliases. Product names and misspellings hide real mentions.
A simple monthly routine
Week one: lock the prompt set, competitor list and brand aliases. Weeks two to four: collect responses (daily if automated). Month end: calculate mention SOV and citation SOV per prompt cluster, compare against the previous month, list the top ten prompts where competitors appear and you do not, and pick two or three to act on. Next month, check whether those moved.
Watch the trend, not the point reading. A steady climb of a few points a month against the same three rivals is a better signal than any single high number.
FAQ
What is a good AI Overview share of voice?
There is no universal number. It depends on how many brands the Overviews name in your category. A share near parity (1 divided by the number of real competitors) is average, and clearly above that is strong. Your trend against named rivals matters more.
How is AI Overview SOV different from ChatGPT SOV?
The engines cite different numbers of sources and favor different source types. Promptwatch Data shows AI Overviews pull 12.2% of citations from social platforms versus 0.46% for ChatGPT (Sep 28 to Oct 4, 2026). The same brand can score very differently on each.
Should I count mentions or citations?
Both. Mentions show awareness inside the answer, and citations show whether your content is used as a source. A gap between them tells you what to fix.
How many prompts do I need?
At least 25 to 50 that trigger AI Overviews, run repeatedly. Fewer prompts make the percentages swing on one or two answers.
How often should I measure?
Weekly or daily if automated, with a monthly review. Engine changes can move SOV fast, so a quarterly check is too slow.
For tracker options beyond the ones above, the rank tracking directory at ai-rank-tools.com is a good place to compare.