Key takeaways
- Visibility is not uniform across a client's footprint. A brand can do well in Seattle and barely show up in Denver, so you need to track each city separately.
- Local visibility now has three layers: map pack and local organic, AI answers (ChatGPT, Google AI Overviews, AI Mode), and the third-party sources both pull from.
- Each city needs its own monitor, prompt set, and location setting. Mixing markets in one tracker produces an average that explains nothing.
- City location pages count as landing pages, and landing pages are the second most cited content type in ChatGPT, so each one has to be complete and unique.
- Report per city, not per brand, and tie reports to calls, bookings, and visits instead of rankings alone.
Why city-level tracking is the whole job
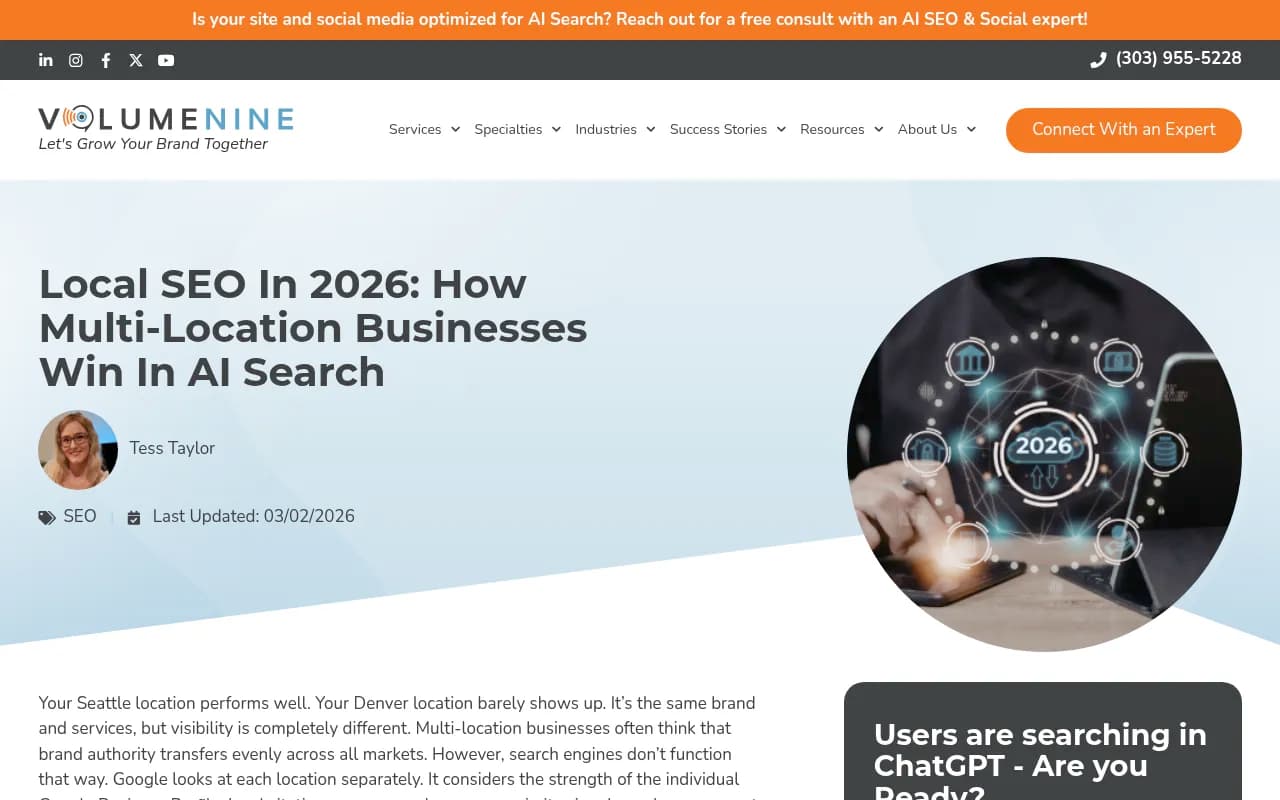
The V9 Digital guide on multi-location local SEO opens with a scenario every agency recognizes: your Seattle location performs well, your Denver location barely shows up, and it's the same brand and the same services. Brand authority does not transfer cleanly from one city to the next.
If you report one blended visibility number for a 30-location client, you are hiding the problem. The strong cities pull the average up, the weak ones disappear, and the client concludes things are fine until a franchisee complains. Everything in this guide follows from one rule: track at the city level, report at the city level, and roll up only after that.
A caveat on the research behind this. Plenty of agency blogs quote local search statistics, and I'd treat most of them as directional. Figures like 76% of "near me" mobile searches leading to a store visit within 24 hours, cited in Big Eye Agency's local SEO and GEO guide, are useful for a client pitch but not for a measurement plan. Your own per-city data matters more.
The three layers of local visibility
Before picking tools, separate what you are actually measuring. Most reporting problems come from blending these together.
Layer 1: map pack and local organic
This is classic local SEO. Google ranks local results on proximity, relevance, and prominence. Proximity is the awkward one because it changes by the searcher's position, so a single "rank" for a keyword is close to meaningless. Grid-style tracking, where you sample rankings from several points around a location, gives a truer picture than one number per keyword.
Layer 2: AI answers
When someone asks ChatGPT or Google AI Mode for the best plumber near them, the answer may name three businesses and cite a handful of sources. Whether your client is named, where, and with what tone is a separate measurement from map rank. A location can sit in the map pack and still be absent from AI answers, or the reverse.
Layer 3: the sources underneath
AI engines mostly repeat what review sites, directories, local publications, and your client's own pages say. Tracking which sources get cited for each city tells you where to spend effort. Weak citations in one city usually trace back to thin or inconsistent listings, not to the AI model.
Set up the tracking structure first
Before you add a single prompt, decide how the account is organized. I've seen agencies skip this and regret it by month three.
One monitor per city
Pick a unit that matches how the client thinks about the business: city, metro area, or individual store. Then create a separate monitor for each. Keeping language and location fixed per monitor means markets never mix, and any trend you see belongs to one place.
A shared prompt template with local variations
Build a core set of prompts once, then localize it. A template might look like this:
[service] in [city]
best [service] near [neighborhood]
[service] [city] pricing
[brand] vs [competitor] in [city]
is [brand] [city] any good
emergency [service] open now [city]
This gives you comparable data across cities. Add a handful of city-specific prompts per market for things only locals ask about, like a named neighborhood or a regional competitor.
Include branded, commercial, and informational prompts
Branded prompts tell you what AI says when someone already knows the client. Commercial prompts ("best X in Y") are where new customers come from. Informational prompts catch people earlier. Tag them so you can report on each type.
Use real coordinates where the tool allows it
Local AI answers depend on where the user is. Tools that let you pin a monitor to exact coordinates, rather than just a country or city name, get you closer to what a customer standing in that neighborhood would see. This matters most for "near me" queries and for clients with several locations in the same metro area.
What to measure for each city
A short, consistent scorecard beats a 40-metric dashboard no client reads.
| Metric | What it tells you | Typical fix when it's weak |
|---|---|---|
| Map pack presence and grid coverage | Whether the location shows up for nearby searchers | Google Business Profile completeness, reviews, category choices |
| AI visibility per city | How often the brand is named in AI answers for that city | Location page quality, third-party listings, reviews |
| Position within answers | Whether the brand is first or fifth in the list | Stronger citations, clearer differentiators |
| Share of voice vs local competitors | Your slice of all brand mentions in that market | Content and review gaps relative to competitors |
| Sentiment | Tone of what AI says about the location | Review responses, fixing inaccurate pages |
| Cited sources | Which sites AI draws on for that city | Fix or claim listings on those sites |
| Conversions (calls, bookings, direction requests) | Whether any of this makes money | Tracking setup, landing page work |
Read them together. Low share of voice is a coverage problem. Late position is a prominence problem. Mentions without citations to the client's own site point to a content or crawlability problem. Weak sentiment is a reputation problem. That diagnostic ordering saves a lot of guessing.
What AI engines cite, and what it means for location pages
Promptwatch Data has no report on local or city-level citations, so nothing here is local-specific evidence. But its general data on which content types ChatGPT cites (Sep 28 to Oct 4, 2026) points at a few things worth acting on:
- Product pages are the most cited type at 22.4% of classified citations, followed by landing pages at 16.8% and listicles at 13.6%.
- For branded prompts, product pages (23.3%) and landing pages (22.8%) earn almost half of citations, and reviews rise to 5.6%, more than three times their share across all prompts.
- For commercial prompts, product pages reach 26.0%, landing pages 20.6%, and listicles 15.0%.
My inference, and it is an inference: each city's location page works as a landing page, so it should be complete, factual, and different from the page for the next city. A template with the city name swapped in is the obvious failure. Include local staff, service areas, real photos, parking or access details, local pricing where it varies, and an FAQ. Reviews on trusted third-party sites matter more when users ask about a named brand, which fits the review share jump on branded prompts.
On page structure, Promptwatch's query fanout data shows ChatGPT averaging about 2.15 web searches per response in early December 2025, easing to about 1.84 by early March 2026, with average query length falling over the same period. Short, keyword-like searches mean headings that read the same way tend to match them, with the entity and category up front. A local example would be "Plumber in Austin pricing". Treat the averages as the number to rely on; they vary a lot by prompt.
Tools for tracking multi-city visibility
No single product covers every layer. Most agencies end up with a local-specific tool for map and listing data, plus an AI visibility platform for answers.
AI visibility across cities
Promptwatch is the one I'd look at first for the AI layer, mainly because of how it handles location. Monitors are fixed to one language and location, so markets don't blend, and Business and Agency Scale plans let you pin a monitor to exact coordinates (20 m to 5 km accuracy radius) so ChatGPT, Google AI Overviews, and Google AI Mode answer as if asked from that spot. State and city tracking is available on Business, agency, and Enterprise plans. It goes past reporting too: content gap analysis, the Content Agent (Business and Enterprise), and the Action Board help with the fixes, and its AI crawler logs show whether bots can actually read each location page.
For agencies specifically, Promptwatch's agency plans include unlimited projects and team seats, so one client per project and one monitor per city is workable. Kick-off is $199/mo, Growth $399/mo, and Scale $799/mo, and Scale adds tracking every 12, 6, or 1 hours plus local GEO/SEO targeting and Fact Check. Confirm current numbers at promptwatch.com/pricing. A 7-day free trial is available on monthly billing, and the free AI visibility report gives you a quick scan before you commit. Agency plans don't include the Content Agent or white-label client portal; those sit with Enterprise.
Local rankings, listings, and reviews
BrightLocal covers local rankings, listings, and reviews in one platform, which makes it a natural pairing for the map pack layer.
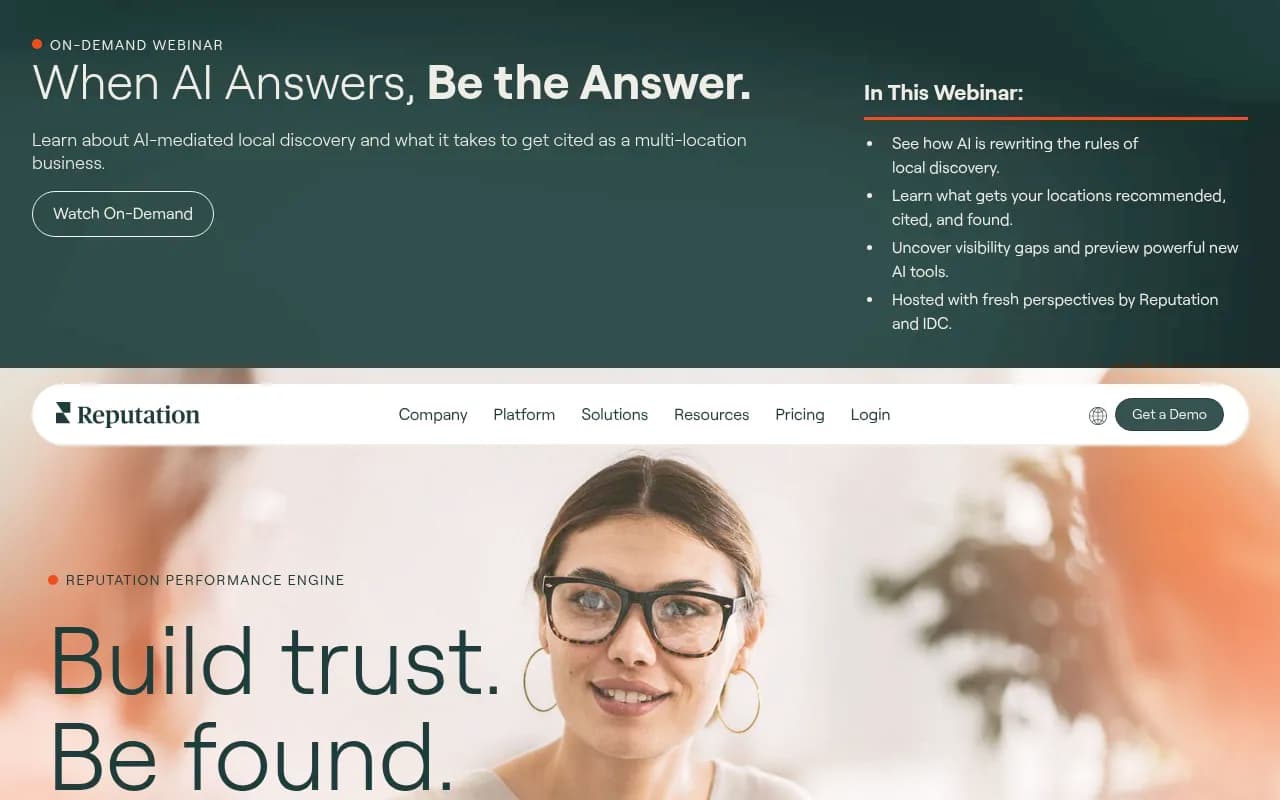
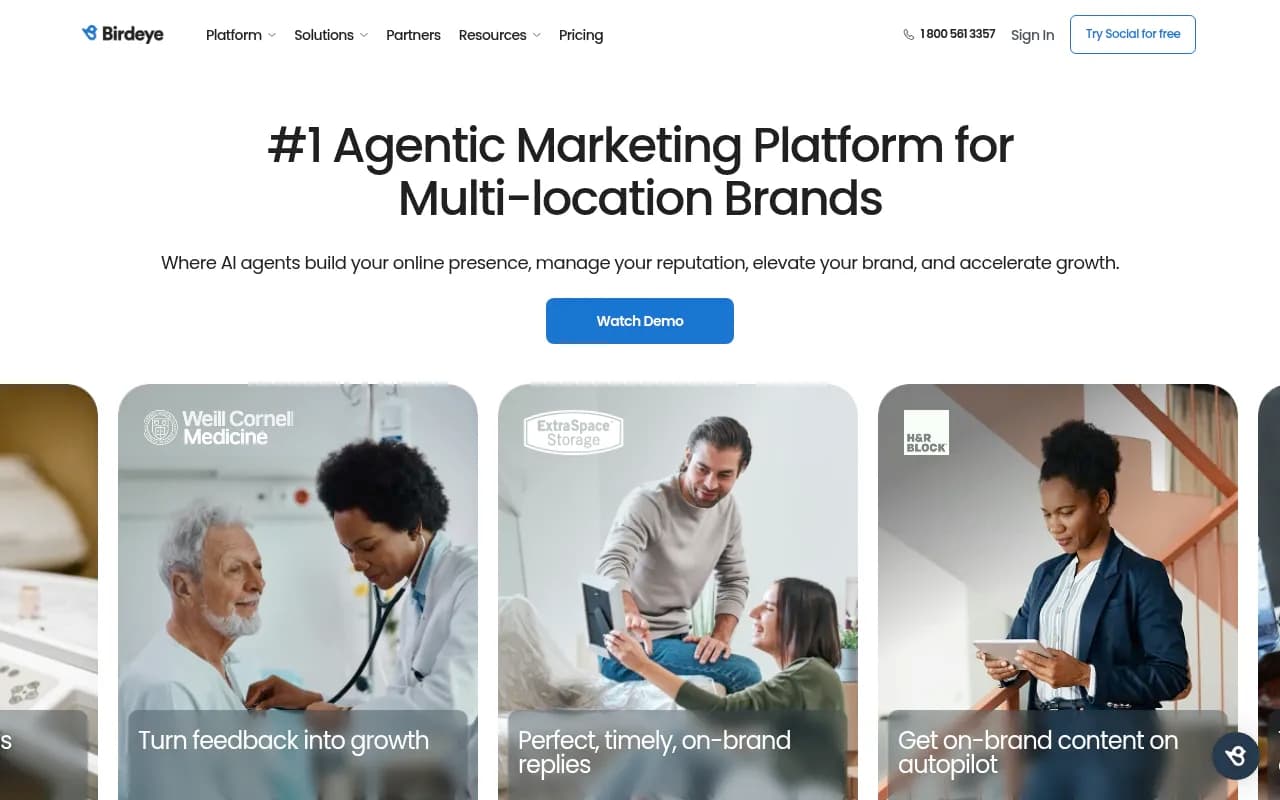
For reviews and reputation across many locations, Reputation.com, ReviewTrackers, and Birdeye are built for that job, and GatherUp adds fake-review defense for local brands.

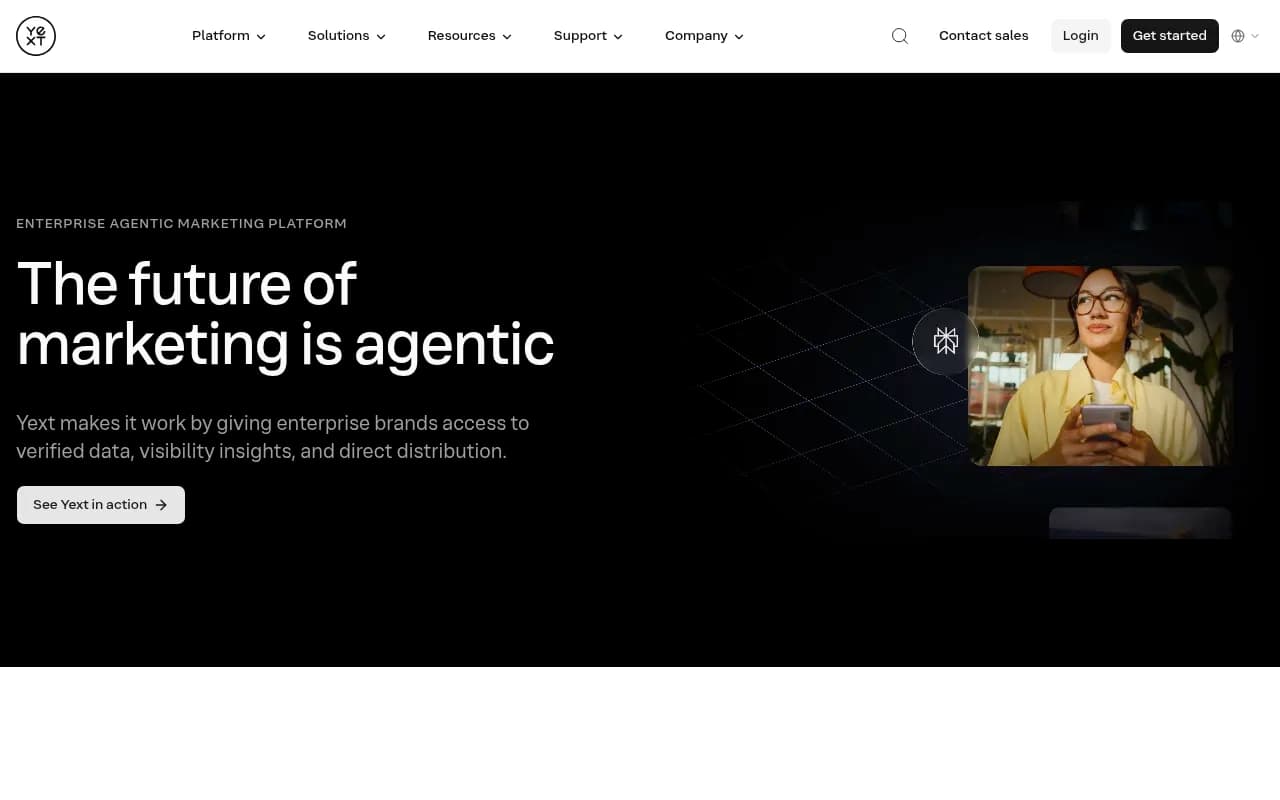
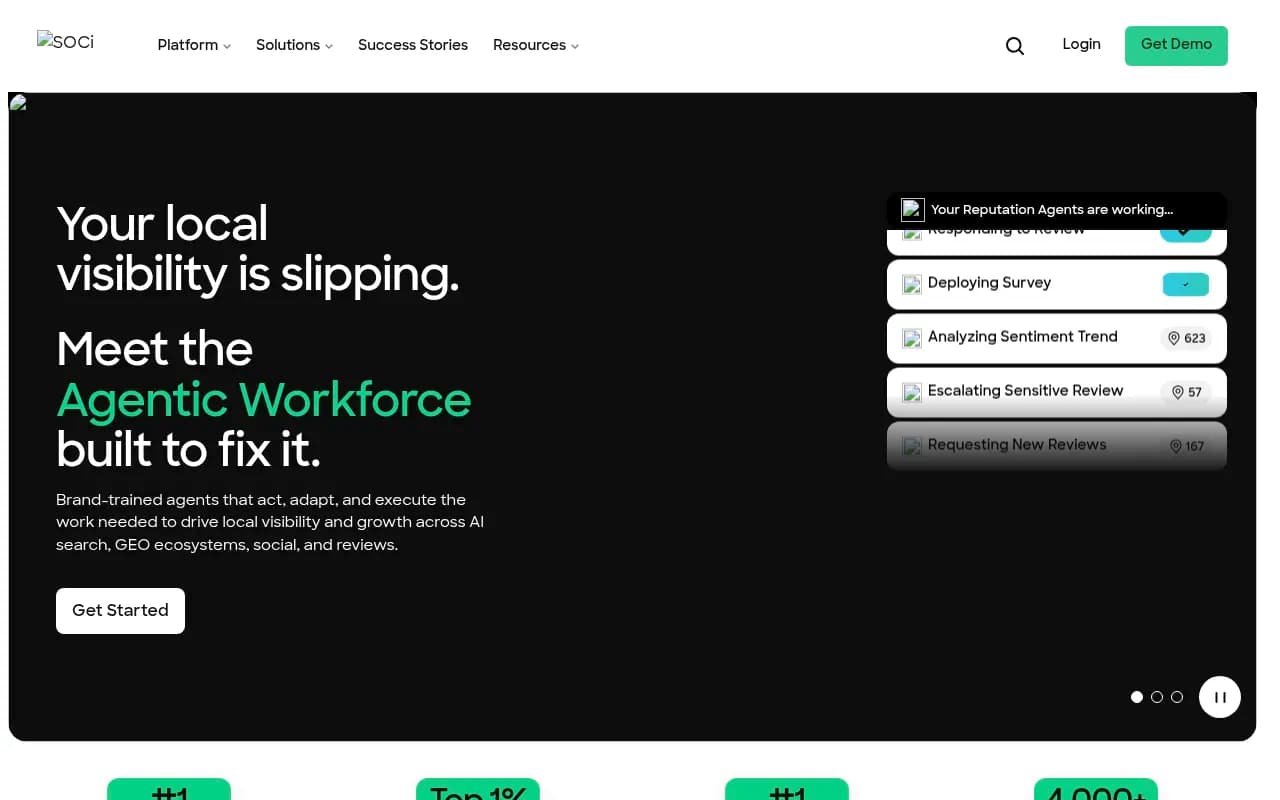
Yext handles listings and a digital presence across locations, and SOCi positions itself around local search, social, and reviews for multi-location brands.
Reporting and dashboards
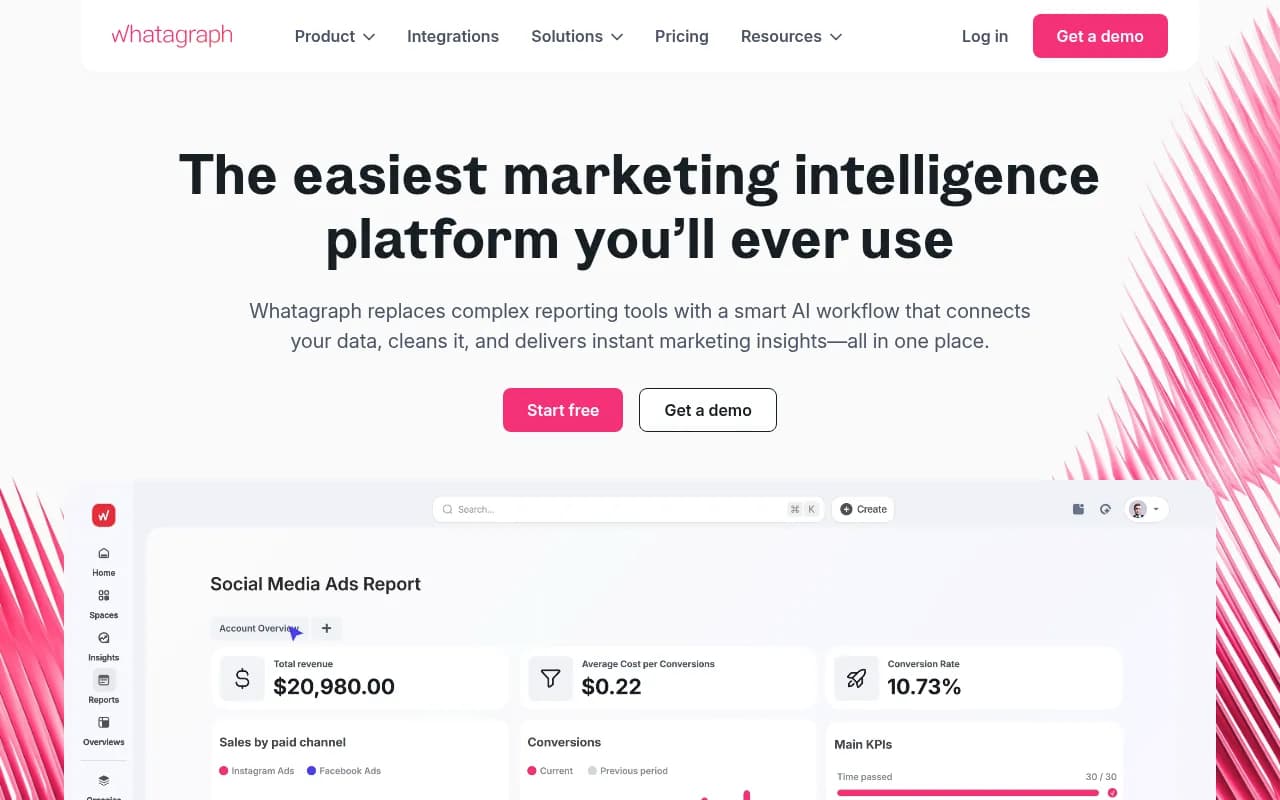
Whatagraph is built for agency reporting if you need to merge local and AI data into one client view.
How they compare
| Need | Tool options | Notes |
|---|---|---|
| AI answers per city, exact coordinates | Promptwatch | Location pinning on Business, Agency Scale, Enterprise |
| Local rankings, listings, reviews | BrightLocal | Map pack side |
| Review management at scale | Reputation.com, ReviewTrackers, Birdeye, GatherUp | Pick by volume and integrations |
| Listings and presence management | Yext, SOCi | Better for larger multi-location brands |
| Client reporting | Whatagraph | Pulls multiple sources together |
If you want to browse more options in the category, the GEO software directory lists the AI visibility tools in one place.
Build the reporting for clients
Clients with 12 locations don't want 12 dashboards. They want to know which cities are winning, which are slipping, and what you're doing about it.
A simple monthly structure
- A one-page rollup with a city comparison table: AI visibility, share of voice, map coverage, and conversions per city.
- A short list of the three weakest cities and the likely cause of each.
- Actions taken and actions planned, tied to cities.
- Competitor movement in the two or three markets that matter most.
A heatmap with cities on one axis and models or topics on the other makes weak spots obvious in a glance. Scheduled PDF reports saves you from rebuilding the same deck every month.
Set expectations early
AI answers vary between runs, and local results shift with location. Tell clients in the first meeting that you will report trends over weeks, not single-day snapshots. Agree on the numbers that count, which should include calls, form fills, direction requests, or bookings, not only visibility. For AI traffic, attributing AI traffic takes some setup, and note that ChatGPT stopped sending a referrer on October 8, 2026, so tagging links with utm_source=chatgpt.com helps recover that traffic.
A 30-day rollout for a new multi-city client
Week 1: baseline
List every location and its Google Business Profile status. Create one monitor per city with the shared prompt template. Run a crawl or site audit to catch location pages that are blocked, thin, or orphaned.
Week 2: find the gaps
Compare cities. Where is the brand absent from AI answers, and which sources are being cited instead? Check listing consistency (name, address, phone) on the sources that appear most. Check that bots can read each location page.
Week 3: fix the worst cities first
Rewrite location pages that are near-duplicates. Fill listing gaps. Start review collection in cities with few reviews. Add FAQs based on the questions that appear in your tracked prompts.
Week 4: first report
Present the baseline, the diagnosis per city, and the plan. Don't promise rank movement in four weeks. Do show that you know why each city is where it is.
Common mistakes
- Tracking one "brand" prompt set and assuming it represents every city.
- Using the same page template with only the city name changed.
- Measuring map rank from the agency's office instead of from the customer's area.
- Ignoring the AI layer because map pack numbers look healthy.
- Reporting rankings with no tie to calls or bookings.
- Letting listings drift out of sync after a location moves or changes hours.
Where an agency partner fits
If your team is stretched across local SEO and AI search, 1001 SEO Media works with brands and agencies on technical SEO, local SEO, and generative engine optimization, and uses Promptwatch for AI visibility tracking. It's a reasonable route if you'd rather hand off the AI layer than build the capability in-house.
Bottom line
Track each city as its own market, keep the prompt template consistent so cities are comparable, and measure map presence, AI answers, and the sources underneath as three separate things. Fix the weakest city first, report by city, and tie every number back to a call or a booking. Everything else is tooling.