Key takeaways
- Looker Studio is the best route for shared, client-facing dashboards. Excel is the best route for modeling and one-off analysis. CSV is the lowest common denominator that connects the two.
- Looker Studio has no native Excel connector. You go through a partner connector, through Google Sheets, or through a manual CSV upload that you repeat on every refresh.
- The CSV file-upload connector supports a single file of up to 20MB, which matters quickly when you store one row per citation.
- GEO data is many-to-one: a single AI response can cite 10 or more domains, so your export should be row-per-citation, not row-per-prompt.
- Pick the route by who reads the report and how often it refreshes, not by which tool you like best.
Why GEO reporting breaks naive exports
Most SEO reports are built on tidy tables: one keyword, one position, one URL. AI visibility data is not like that. One prompt produces one response, and that response mentions several brands and cites several sources. Flatten it into a single row and you lose most of what matters.
Promptwatch Data gives a sense of the shape. In its unique domains per response report (Sep 28 to Oct 4, 2026, responses with at least one citation), 47.6% of ChatGPT responses cited 10 or more unique domains and 66.1% cited at least 8. Only 6% cited 3 or fewer. Brand-specific prompts behaved differently: just 21.3% cited 10 or more domains, and the most common count was 5.
The engines also differ from each other. Per Promptwatch's average sources per response data, ChatGPT cites about 5 sources per web-search answer, Google AI Overviews about 10, and Perplexity almost exactly 10 every day. Copilot swung from under 2 to nearly 17 within a few weeks before settling at the low end.
Two design rules fall out of this:
- Export at the citation level. One row per prompt, response, model and cited domain.
- Keep prompt type (organic, brand-specific, competitor comparison) as its own column, because the averages differ so much between types that blending them hides the signal.
Whichever route you choose below, build the underlying table this way first.
The three routes at a glance
| Route | Live refresh | Best for | Main limit |
|---|---|---|---|
| Looker Studio connected to a live source | Yes | Shared dashboards, client reporting | Needs a supported connector or a Sheets bridge |
| Excel workbook | Manual or scripted | Modeling, pivots, one-off analysis | No native Looker Studio connector |
| CSV file | No, repeat each time | Handoffs, archives, lowest-effort bridge | Single file up to 20MB in Looker Studio upload |
The honest summary: these are not competing so much as stages. Raw data tends to land as CSV, get shaped in Excel, and get displayed in Looker Studio. The question is which stage you can skip.
Route 1: Looker Studio as the reporting layer
Looker Studio (Google's documentation now calls it Data Studio in places) is the right choice when more than two people need to see the numbers and nobody wants to open a spreadsheet. It handles sharing, scheduled delivery and filter controls that stakeholders can use without breaking anything.
For GEO work, a Looker Studio dashboard usually carries visibility over time, share of voice by competitor, top cited domains, and AI-referred traffic. Those are all aggregate views, which suits a dashboard well. The row-level citation detail stays in the source and gets filtered down.
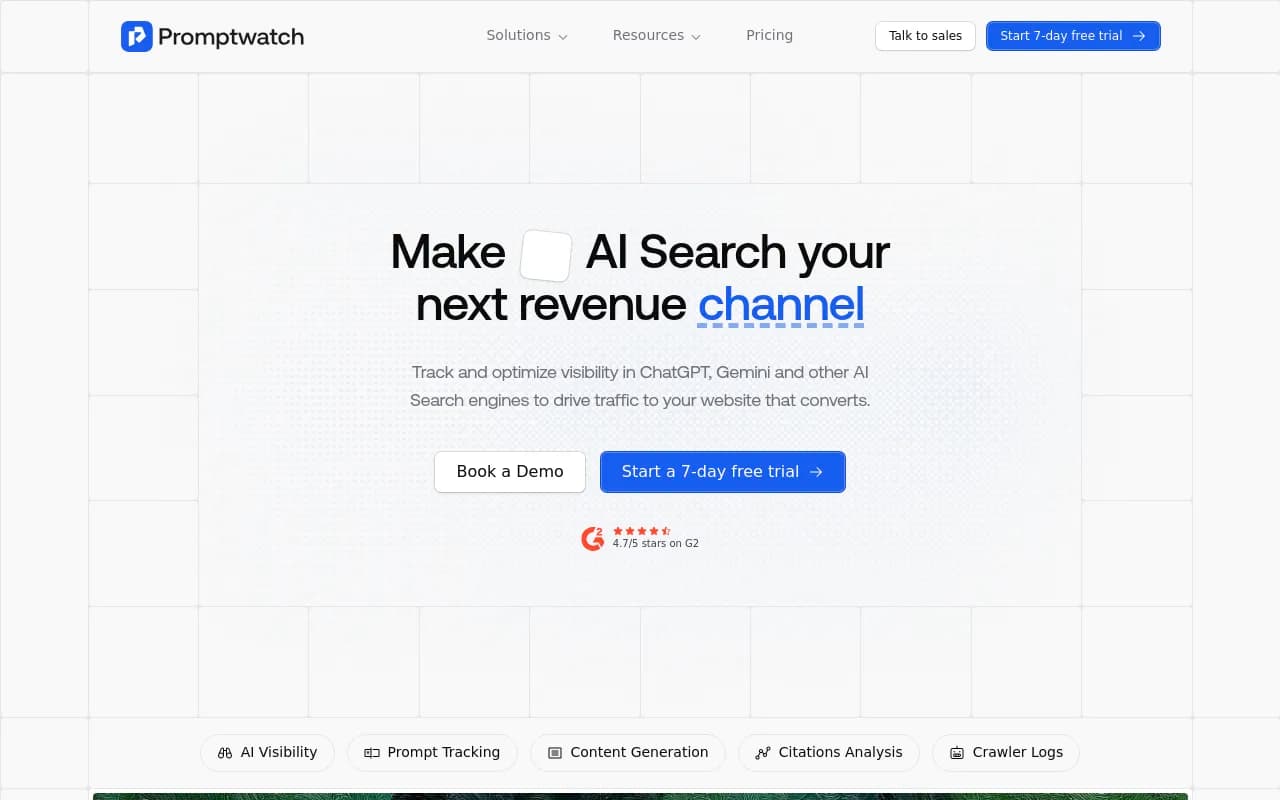
Some AI visibility platforms ship a Looker Studio connector so you skip the file shuffling entirely. Promptwatch has one, available from its Professional plan, alongside a REST API and MCP server for pulling data programmatically. See its Looker Studio connector page for details.
If your platform has no connector, you are back to the bridging methods below.
Exporting data back out of Looker Studio
Going the other direction works too. Google's documentation covers exporting data from a chart: open the chart's menu, choose Export data, name the file, and pick a format. One option is worth knowing about for GEO reports: "CSV (Microsoft Excel)" creates a comma-separated file where non-ASCII characters are encoded properly for Excel. If you track prompts in several languages or brand names with accents, use that one. Plain CSV opened in Excel is where garbled characters come from.
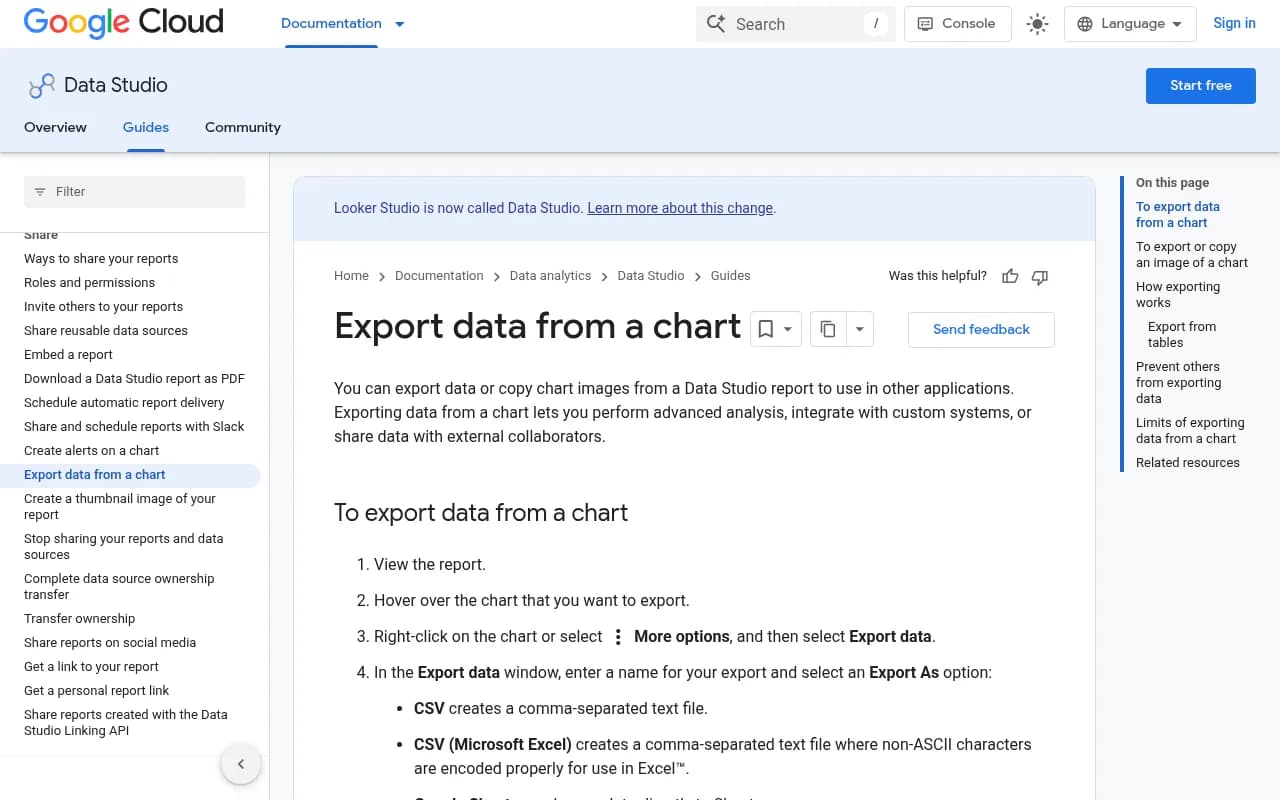
The same page describes how to prevent others from exporting data, which is useful when a client dashboard should show numbers but not hand over the raw tables.
Exporting a whole dashboard to a single Excel file is a different story. Community threads, including one on Google's developer forum, show people asking for exactly this, and chart-by-chart export is the documented path. Plan for per-chart exports, or keep the source data somewhere you can query directly.
Route 2: Excel as the modeling layer
Excel earns its place when you need to do things a dashboard handles badly: join GEO data to revenue, build pivot tables on citation-level rows, run a quick regression, or hand an analyst a file they can poke at.
The problem is connecting it to Looker Studio. There is no direct integration. The Coupler.io walkthrough lists the options plainly:
- A partner connector that sits between Excel and Looker Studio (Coupler.io is one example).
- A workaround through Google Sheets: sync Excel to Sheets, then connect Sheets to Looker Studio using its native connector.
- A manual CSV export, which does not actually connect anything. You repeat it every time you want fresh data.

I would pick the Sheets bridge for most small teams. It costs nothing, Looker Studio reads Sheets natively, and the failure modes are easy to see. The partner connector is worth paying for only if you have many workbooks or need refreshes you do not have to babysit. I did not find current Coupler.io pricing in my research, so check it before committing.
Preparing the workbook
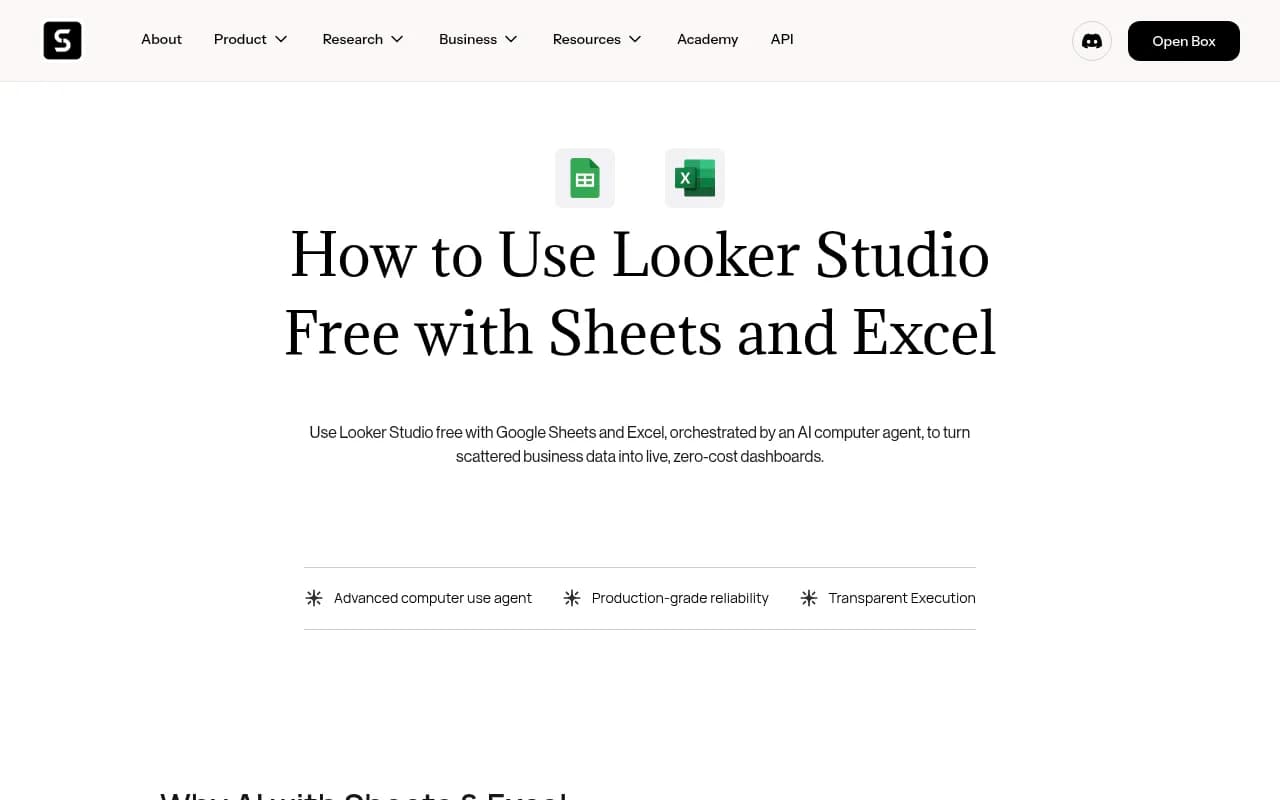
Whichever bridge you use, the workbook needs to be boring. A guide from Simular gives the checklist: remove merged cells, keep one header row, and turn the range into a real table with Insert, then Table. Dashboards choke on decorative formatting.
For a GEO workbook, a sensible column set is:
date, model, country, language, prompt, prompt_type, brand_mentioned, position, sentiment, cited_domain, cited_url
That is one row per citation. Keep any calculated metrics (visibility score, share of voice) on a separate summary tab so the raw tab stays clean.
Route 3: CSV as the bridge
CSV is unglamorous and it works everywhere. Looker Studio's own data connector list describes the file-upload connector as supporting a single CSV file up to 20MB. That sounds generous until you remember the row-per-citation advice above. A busy monitor that runs daily across several models, each response citing 5 to 10 domains, can fill 20MB faster than you expect.
Ways to stay under the cap:
- Upload a monthly slice rather than the full history.
- Pre-aggregate in Excel or a script, and upload the summary while archiving the detail.
- Drop columns the dashboard does not use. Full response text is the usual offender.
If you want CSV without the repetition, the Simular guide describes a scheduled workaround: export the output tab as CSV on a schedule, then use a small macro or a Power Automate flow to upload it to Google Drive or OneDrive. It is fiddly, and I would call it a stopgap, not an architecture. If you reach for this, consider an automation tool such as Zapier or Make instead of macros; both can move files between cloud storage and Sheets on a timer.

Choosing by situation
| Your situation | Route | Why |
|---|---|---|
| Agency sending monthly client reports | Looker Studio on a live connector or Sheets | Clients get a link, you avoid emailing files |
| In-house SEO analyst joining GEO to revenue | Excel | Pivots and joins are faster than dashboard blending |
| Small team, no budget, weekly reporting | Excel to Sheets to Looker Studio | Free and transparent |
| One-off audit or board deck | CSV into Excel | No infrastructure worth building |
| Multilingual prompts | CSV (Microsoft Excel) export | Correct encoding for non-ASCII text |
| Large citation history | Live connector or API, not file upload | The 20MB upload cap |
A note on API and MCP access
If you are comfortable with a little scripting, pulling data by API into Sheets or a warehouse removes most of the pain above. Several GEO platforms expose APIs. Promptwatch's REST API covers visibility, prompts, responses, citations and sentiment, with date ranges up to 92 days so a full quarter fits in one request. That is a platform-specific detail, so confirm what your own tool offers on its docs page.
What to check in your AI visibility tool before you commit
The export route is partly decided for you by what your tracking platform allows. Before you design anything, ask:
- Can it export citations at row level, with model, country, prompt type and cited URL?
- Does it have a Looker Studio connector, or only file export?
- Is there an API for scheduled pulls?
- Does the CSV preserve non-ASCII text?
- Can you segment by prompt type, so organic and brand-specific numbers are not blended?
If you are still choosing a platform, the GEO software directory at bestgeosoftware.com lists options, and the rank tracker directory at ai-rank-tools.com covers the monitoring-only end of the market. Tools like Profound and Peec AI are common names in these comparisons, so check each one's export options against the list above.

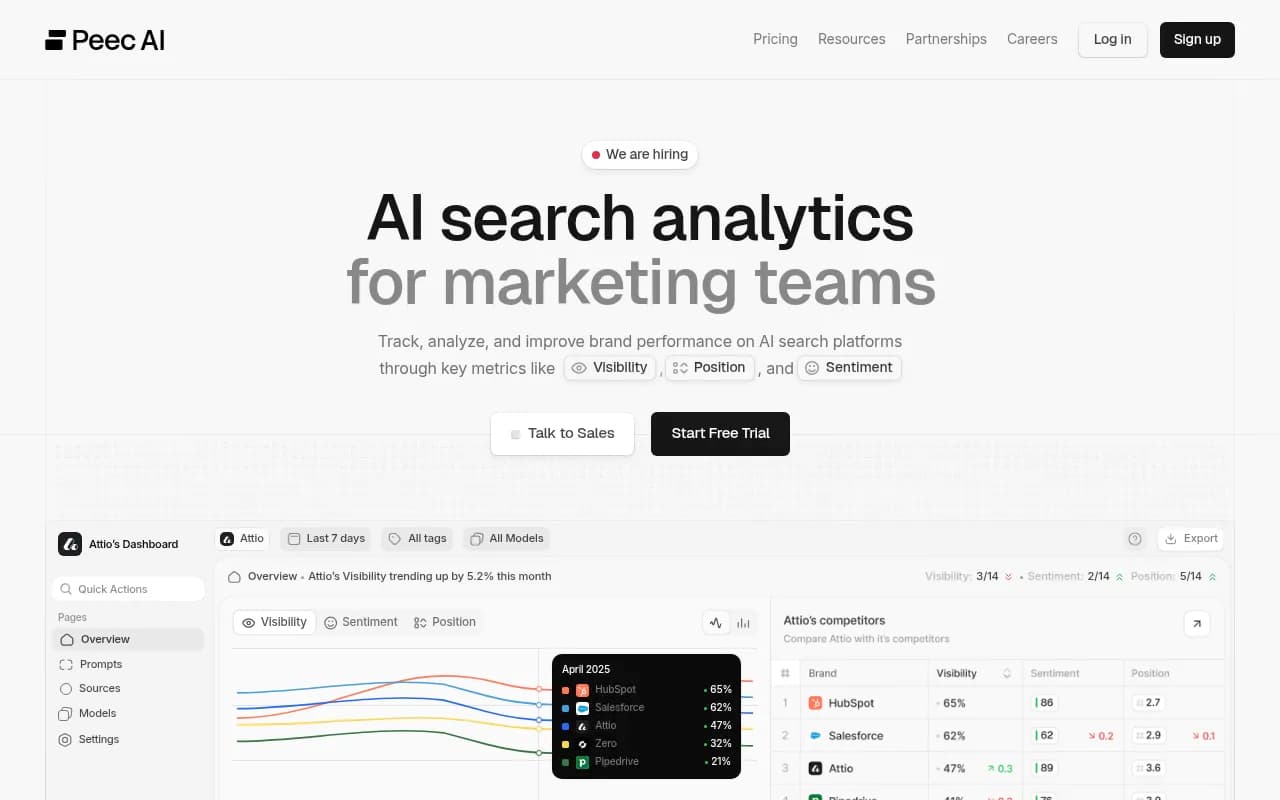
Treat any claim about a competitor's export features as something to verify. I have not tested them here.
Common mistakes
Blending prompt types is the big one. Brand-specific prompts cite far fewer domains than organic ones, so an average across both tells you little.
Second, reporting from a single day. Copilot's citation counts swung wildly over a few weeks, and Promptwatch advises judging it on monthly trends, not weekly snapshots. Build your date axis accordingly.
Third, treating a manual CSV upload as a live connection. It is not. The Coupler.io post says as much: you repeat the process every time you want fresh data. Put a recurring calendar reminder on it, or automate it.
Fourth, formatting the workbook for humans. Merged cells and multi-row headers look nice and break every connector.
What I would do
For a team starting from scratch in 2026: get citation-level data out of your tracking platform, ideally through a live connector or API. Put summary views in Looker Studio for stakeholders. Keep an Excel workbook for the analyst who needs pivots, and use the Excel-flavored CSV export for multilingual text. Reserve plain CSV upload for archives and one-offs, and watch that 20MB ceiling.
If none of that is available from your current tool, the Sheets bridge is the cheapest way to get a working pipeline by the end of the week.
For related reading on what to track once the pipeline exists, browse the Promptwatch Data reports for current benchmarks on citations per response and content types AI engines cite.