Key Takeaways
- Real UI tracking captures what users see in ChatGPT, AI Overviews or Perplexity. API polling captures what a model returns through a developer endpoint. The two can differ in answers, citations and shopping results.
- I did not run a lab benchmark for this guide, and no independent UI-versus-API dataset exists in the sources I could verify. What follows is a test framework you can run in about two weeks, plus what is known about measurement noise.
- Engines move on their own. Citation counts and query fan-outs shift in steps, so compare every tool over the same window or you will blame the wrong vendor.
- Score tools on mention agreement, citation overlap, position, repeat-run variance and freshness against a manual ground truth.
- Ask every vendor in writing which surfaces they collect from the real interface and which through an API.
Why this test matters for enterprise buyers
Every GEO platform shows a headline visibility number. Whether that number reflects what your customers actually see depends on how the data was collected, and vendor pages rarely say so clearly.
There are two broad collection methods:
- Real UI tracking runs prompts through the consumer interface, such as chatgpt.com or the Google AI Overview panel, in a chosen country and language, then parses the answer, the citations and any shopping cards.
- API polling sends prompts to a model endpoint. This is cheaper and easier to scale. But an API call to a model is not the same product as the web experience. Search grounding, citation formatting, shopping modules and regional behavior can all differ.
API data is not worthless. It shows what a model believes from training data, which is useful for brand narrative work. The problem starts when a dashboard blends the two and labels both "ChatGPT".
The public roundups I reviewed are useful for shortlists but thin on this question. The Meikai enterprise comparison says outright that public capability pages "cannot establish data quality", and Meikai is also a vendor that ranks itself first, so read its ranking with that in mind. Two hands-on write-ups, one on Medium and one from Licheo, tested tools against manual checks or the same brand over eight weeks. They are a decent model for method, even if I would not lift their rankings.
What we know about measurement noise
Before you blame a tool for being wrong, rule out the engine being unstable. Two first-party reports from Promptwatch Data show how much the ground moves.
Promptwatch's Average Sources Per Response report, which updates daily, shows very different behavior per engine:
- ChatGPT cites about 5 sources per answer when web search is triggered, and the average drifts with model and retrieval updates.
- Google AI Overviews cites about 10 and stays steady.
- Perplexity sits almost exactly at 10 every day. The report suggests using it as a test bench because it barely moves.
- Copilot's average swung from under 2 to nearly 17 sources within a few weeks before settling low. The report advises judging Copilot on monthly trends, not weekly snapshots.
The ChatGPT Query Fanouts report shows the same thing at the retrieval layer. Average fanouts per response fell from about 2.15 in early December to about 1.84 by early March, and came back in April at 1.0 per response. Average fanout query length fell from about 117 characters to the high 80s, then to about 53. The same page also says a single prompt can trigger 3 to 8 or more searches, which conflicts with those averages, so rely on the measured numbers.
The practical lesson: if Tool A and Tool B disagree on ChatGPT citations, check the collection dates first. Retrieval behavior changes in steps. A tool can look inaccurate simply because it ran last Tuesday and the other ran this Tuesday.
The 8 platforms to put through the test
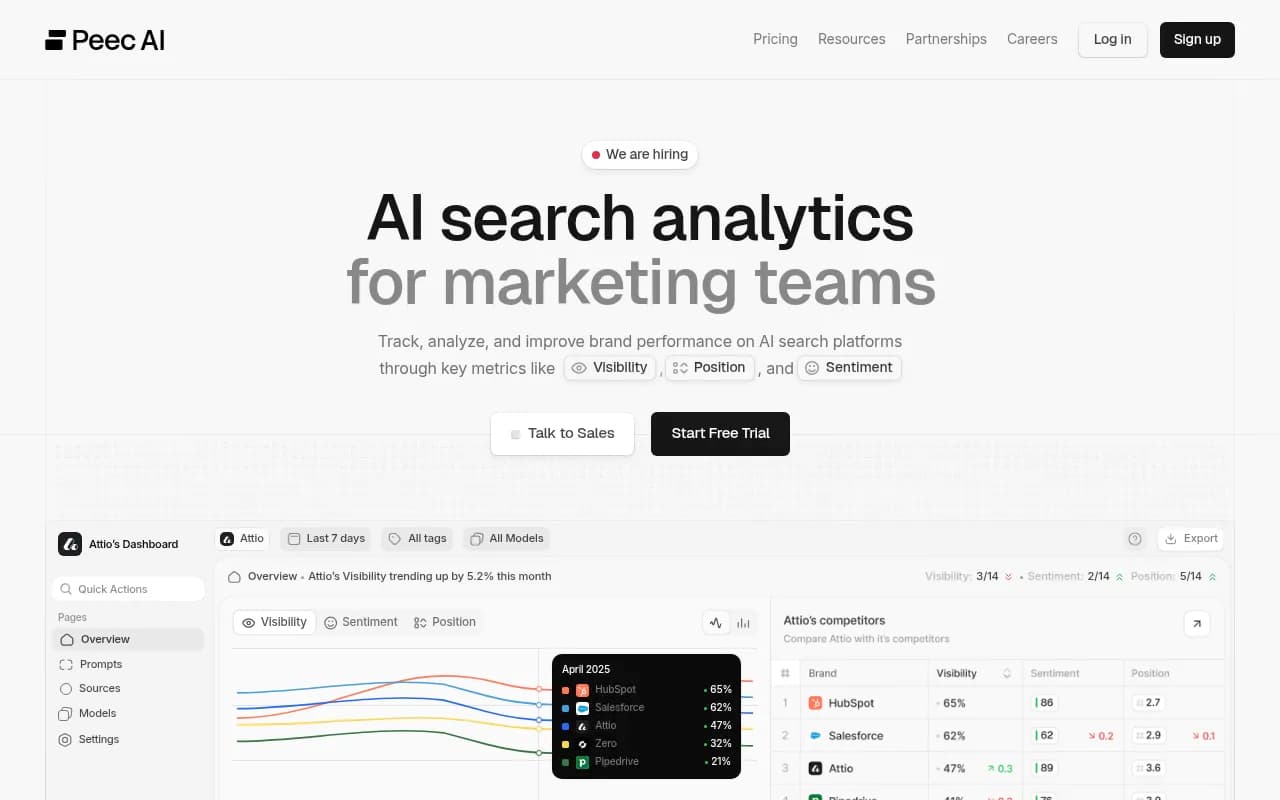
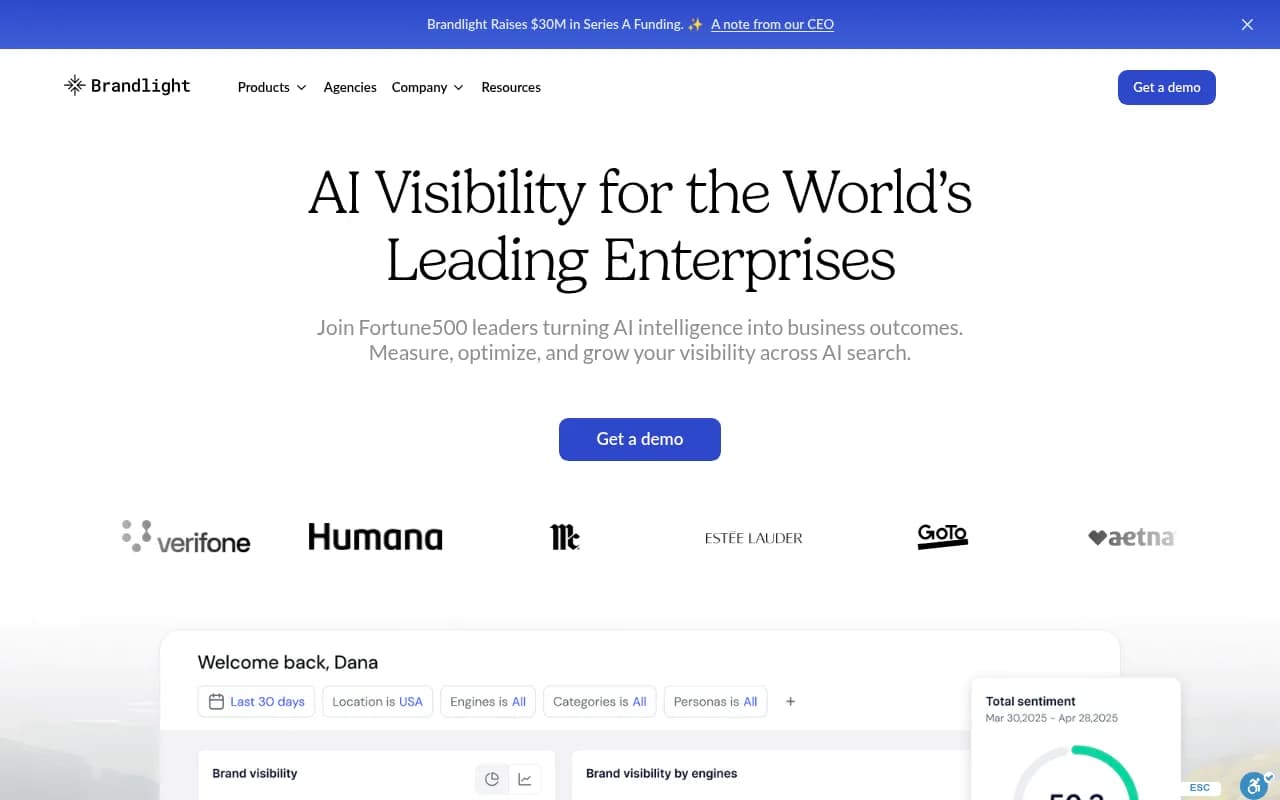
Pick eight and test them side by side. A sensible enterprise shortlist, based on who gets compared most often, looks like this. The method column is intentionally blunt: I could only verify Promptwatch's documented approach for this guide, so the rest is a question for each vendor.
| Platform | Collection method to verify | Status in this guide |
|---|---|---|
| Promptwatch | Real interface of ChatGPT, Google AI Overviews, AI Mode, Copilot, Gemini, Perplexity, Alexa, Meta AI, per country and language; API models tracked separately | Documented by vendor |
| Profound | UI, API or mix per engine | Ask vendor |
| Scrunch | UI, API or mix per engine | Ask vendor |
| Otterly.AI | UI, API or mix per engine | Ask vendor |
| Peec AI | UI, API or mix per engine | Ask vendor |
| AthenaHQ | UI, API or mix per engine | Ask vendor |
| Bluefish | UI, API or mix per engine | Ask vendor |
| Brandlight | UI, API or mix per engine | Ask vendor |
Promptwatch is the one I can describe firsthand: it collects from the actual user interfaces and tracks API models like Claude, DeepSeek, Mistral and Grok alongside, so you can see what the web product says versus what the model knows. Its dataset covers 26.5 billion+ citations, clicks and prompts, and the platform goes past monitoring into content gap analysis, crawler logs and a Content Agent. For a head-to-head on any of the others, see Promptwatch vs Profound and the 2026 platform comparison. Pricing changes, so confirm plans at promptwatch.com/pricing.

If you want a wider field first, the GEO software directory at bestgeosoftware.com lists far more options than eight.
Step 1: Build a fair prompt set
Use 60 to 100 prompts. Fewer than that and one odd answer swings your result.
- Split them into organic category prompts, brand-specific prompts and competitor comparisons. Commercial and branded prompts behave differently from informational ones.
- Include at least two markets or languages if you operate in more than one. A monitor's country and language should be fixed, so markets never mix.
- Add 10 prompts where you know the right answer, such as your pricing model or HQ location. These are your fact checks.
- Freeze the set. Do not edit prompts mid-test.
Step 2: Create the ground truth
The ground truth is a human running the same prompts in a clean browser session, logged out where possible, with a VPN or location set to the target market.
- Run each prompt manually three times, at different hours.
- Record whether your brand appears, its position among named brands, every cited URL, and any shopping or ad modules.
- Mark a prompt as "unstable" if the three manual runs disagree on brand mention. Report those separately. Tools should not be penalized for noise the engine itself produces.
This is tedious, and it is the part most vendor comparisons skip. The Medium test reviewed for this guide used the same idea, checking citation tracking against manual checks.
Step 3: Run all eight tools on the same window
Put every tool on the same prompts, models, country and language. Run for at least 14 days so you capture engine drift. If one tool only offers weekly runs, align its run day with your manual checks.
Two settings matter:
- Tracking frequency. Daily is common. Some platforms allow every 12, 6 or 1 hours on higher plans, which gives a steadier number and helps if you are following a launch.
- Brand rules. If your brand name is also a common word, set analysis instructions so the tool decides correctly what counts as a mention. Otherwise your false positives will look like a data accuracy problem.
Step 4: Score what matters
| Metric | How to calculate | What a weak score tells you |
|---|---|---|
| Mention agreement | Share of stable prompts where tool and manual run agree on brand present or absent | Tool is reading a different surface, often an API |
| Citation overlap | Jaccard similarity of cited domains per prompt | Different retrieval path or stale data |
| Position agreement | Share of prompts where brand order matches within one rank | Parsing problems or different answer format |
| Repeat-run variance | Standard deviation of mention rate across the tool's own repeated runs | Tool is not controlling for noise, or reports single samples |
| Freshness | Hours between tool timestamp and manual run | Data is cached or batched |
| Surface coverage | Does the tool show shopping cards, ads and AI Overviews, or only text? | Missing modules, common with API-only collection |
A small script keeps the citation overlap honest:
def jaccard(a, b):
    a, b = set(a), set(b)
    return len(a & b) / len(a | b) if (a | b) else 1.0

# a = domains cited in manual run, b = domains cited by the tool
scores = [jaccard(manual[p], tool[p]) for p in prompts]
print(sum(scores) / len(scores))
Compare domains, not full URLs. Tracking parameters and trailing slashes will otherwise drag your score down for no real reason.
Step 5: Read the results like an adult
A few patterns you are likely to see, and what they usually mean:
- High mention agreement but low citation overlap. The tool sees the same brands but a different source list. That often points to an API response versus a web-grounded one.
- Good results on Perplexity, poor on ChatGPT. Perplexity is the steady engine, so a gap there is meaningful. ChatGPT gaps may just be drift, which is why the same-window rule matters.
- Copilot looks wildly different week to week in every tool. Expected, given the swings in Promptwatch's data. Judge it monthly.
- A tool scores well but cannot say which pages AI actually fetched. Accuracy of the answer is only half the problem. You also want to know whether AI bots read your pages at all. IP-verified crawler logs, like Promptwatch's AI crawler logs, separate an access problem from a content problem.
Questions to put to every vendor
Email these and keep the answers on file for procurement:
- For each engine, is data collected from the consumer interface, an API, or both? Can I filter to UI-only?
- How do you handle geolocation, and can I verify it per run?
- How many samples per prompt per day, and do you report averages or single runs?
- Do shopping cards, ads and AI Overview modules appear in the data?
- Can I export raw responses with timestamps and citation lists?
- What happens to historical data when a model is deprecated?
- What certifications do you hold? ISO/IEC 27001 and GDPR handling matter in enterprise security reviews.
A vendor that cannot answer question 1 clearly is telling you something.
Which method fits which buyer
- Brands that care about what customers see (retail, travel, finance) should lean on UI collection for the engines users actually open, with API models as a secondary view of model belief.
- Teams doing large-scale, low-cost directional tracking may accept API polling for some engines, provided the dashboard labels it honestly.
- Agencies need exportable raw data so they can defend numbers to clients. Check the agency plans and equivalents elsewhere.
- Anyone connecting visibility to revenue should choose a platform that also measures AI-referred traffic, so accuracy is validated against real visits and not just against other dashboards.
For rank-tracker style directories, ai-rank-tools.com is a handy place to find more candidates to add to your test.
A two-week timeline
| Day | Task |
|---|---|
| 1 to 2 | Build and freeze the prompt set, configure monitors in all eight tools |
| 3 to 4 | Run manual ground truth, first pass |
| 5 to 12 | Tools collect on the same schedule, manual spot checks continue |
| 13 | Final manual pass, export all tool data |
| 14 | Score, flag unstable prompts, write up |
Bottom line
Collection method is the single most useful thing to nail down before buying an enterprise GEO platform, and it is the thing vendors explain least. Run the test above, keep the engines' own drift in mind, and trust the vendor who shows you raw responses over the one who shows you a score. If you want to see real-interface data on your own brand quickly, the free AI visibility report gives you a baseline to compare against what your current tool says.