Key takeaways
- ChatGPT served no ads until May 27, 2026, and Promptwatch Data shows ads in an average of 20.1% of qualifying responses over the following 90 days. A single check tells you almost nothing.
- Ad rate and ad winners are different questions. One tells you if a slot exists, the other tells you who fills it.
- Prompt mix, outlier days, and attribution gaps (like ChatGPT dropping its referrer on October 8, 2026) cause most of the misreads.
- Third-party studies and your own tracked prompts measure different things. Don't mix their numbers.
- Fixing this takes a consistent prompt set, multi-day sampling, per-segment advertiser comparison, and clean UTM tagging.
Why ad tracking in AI answers goes wrong so easily
Sponsored placements in AI answers are new enough that nobody has a settled playbook. OpenAI announced ads for the free tier and the $8/month Go tier on January 16, 2026, and said it would not accept money to influence the answer itself. Google has been putting sponsored placements near AI Overviews and AI Mode for longer, and a thread on r/localseo captured the mood: competitors can now pay their way into high-intent prompts.
So teams started measuring. Most of them did it the way they'd measure a classic SERP: check a few queries, screenshot the result, put a percentage in a slide. That approach breaks down because AI answers are generated, ad slots are intermittent, and the data you get depends heavily on how you sampled it.
Here are the eight mistakes I see most often, and what to do about each.
Mistake 1: Treating one prompt run as the truth
You run "best project management software" in ChatGPT, see no ad, and conclude nobody is bidding. Or you see a competitor's ad and panic.
Both reactions are premature. Promptwatch Data's ChatGPT Ads Over Time report (May 20 to August 17, 2026) shows the daily ad rate climbing in bursts. There was a brief spike on June 25-26, a jump past 30% on July 1 that stuck, and a peak daily rate of 43.9%. A single run can land on an outlier day in either direction.
The fix: check the same prompts across several days before you draw any conclusion. Treat a single screenshot as an anecdote, not a data point.
Mistake 2: Confusing ad rate with ad share of voice
The ad rate says how often an ad slot appears. It says nothing about who wins that slot. Teams routinely report "ads appear on 30% of our prompts" as if that were a competitive finding. It's a market-condition finding.
The competitive question lives in the ad details: advertiser, headline, landing page, and rank. Promptwatch's report makes this exact point, noting that ads on brand-specific and competitor-comparison prompts can differ from those on organic prompts, so advertisers should be compared per segment.
Track two separate numbers:
- Ad rate: percentage of responses that carry any sponsored placement.
- Advertiser share: of the responses with ads, which advertisers show up and how often.
Mistake 3: Comparing numbers from different studies
SE Ranking's study (August 10, 2026) found ads on 1 in 4 commercial queries, and 1 in 7 of those appeared for the wrong topic. Promptwatch Data reports 20.1% over 90 days and a 32.4% seven-day average across all web-search responses.
These are not contradictory. They measure different populations: commercial queries versus responses that ran a web search, returned a citation, and completed ad extraction. Different prompt sets, different time windows, different filters.
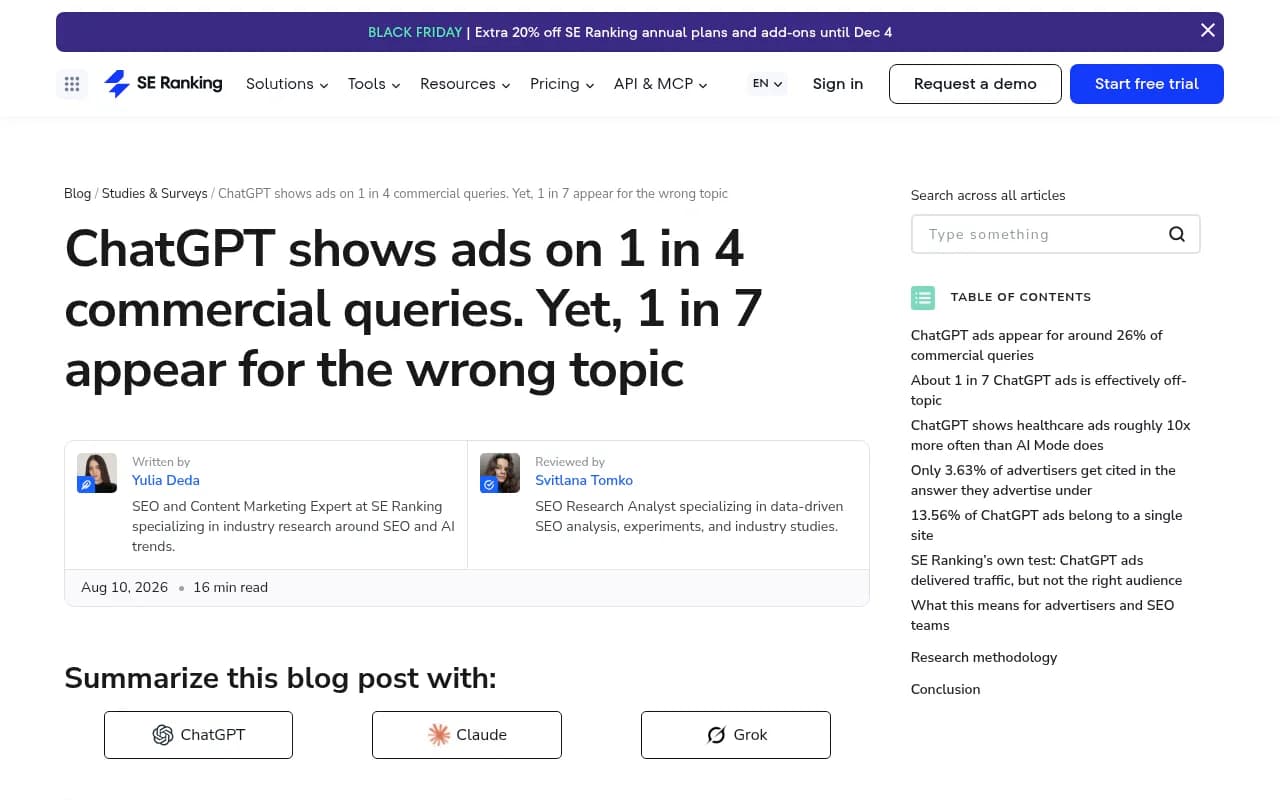
If you quote one study next to another in a deck, say what each one counted. Better yet, pick one source of truth for trend lines and use the others as context.
Mistake 4: Letting your own prompt mix move the chart
This one is sneaky. Promptwatch's 7-day breakdown of ad-bearing responses was 73.3% organic, 18.0% brand-specific, and 8.6% competitor comparison. It's tempting to read that as "organic prompts trigger ads 73% of the time."
They don't. The mix reflects prompt volume. If you add more organic prompts to your monitor, their share of ad-bearing responses rises even if nothing changed on OpenAI's side. The chart shows where ads appeared in your sample, not how likely each prompt type is to trigger one.
To compare prompt types fairly, calculate the ad rate within each type (ads on organic prompts divided by organic prompts run), not the share of all ads each type represents.
Mistake 5: Ignoring the segment: organic, branded, and competitor prompts
A brand sees an ad on a prompt like "[Your brand] vs [Competitor]" and files it with every other ad. That's a different battle. Someone typing a comparison prompt has already narrowed the field, and a rival ad there is a conquesting play aimed at your buyers.
Split your reporting into at least three buckets:
- Organic category prompts, where the field is open.
- Brand-specific prompts, where ads against your name are the concern.
- Competitor comparison prompts, where you may be both defender and attacker.
The ranges in the Promptwatch report are instructive. Organic ranged from 62.71% to 78.32% of ad-bearing responses, and competitor comparison from 7.24% to 15.60%, with the split steadier since July 1. Small buckets move a lot on small samples, so don't over-read them.
Mistake 6: Assuming ChatGPT and AI Mode behave the same
ChatGPT ads and Google's AI Mode and AI Overviews placements sit in different systems. ChatGPT ads are served inside a conversation to free and Go users. Google's sponsored placements come out of the Google Ads ecosystem with its own targeting, bidding, and reporting.
I could not find reliable public ad-rate data for AI Mode, so be skeptical of anyone quoting a precise AI Mode ad frequency. What you can do is track both surfaces on the same prompt set and report them separately, never blended into one "AI ad rate."
A note on AI Overviews more broadly: one LinkedIn post by Erik Fiala claims AI Overviews appear for 16% of queries and ChatGPT drives 0.21% of website traffic. That's a social post without a methodology, so treat it as a rough pointer at best.
Mistake 7: Misattributing the traffic that ads and AI answers send
This is where budget gets wasted. Referral visits from AI platforms often land in Direct because the referrer is missing or stripped. A post from Ignite Visibility described missing ChatGPT UTM tags pushing referral visits into Direct, and the worry that ad budget then goes to the wrong channel.
It got worse for ChatGPT on October 8, 2026, when it stopped sending a referrer. Visits that used to show as chatgpt.com referrals now vanish into Direct unless they carry a tag like utm_source=chatgpt.com.
What to do:
- Tag every link you control with consistent UTMs.
- Count visits tagged utm_source=chatgpt.com as ChatGPT traffic in your analytics.
- Look at landing pages that spike in Direct with no obvious source. Those are often AI visits.
- Read the attributing AI traffic guide for a fuller setup.
If you also run paid campaigns, server-side attribution tools like Triple Whale, Northbeam, or Hyros can help, though none of them were built specifically around AI answer surfaces, so check what they actually capture.
Mistake 8: Tracking ads but not the organic answer next to them
An ad doesn't live alone. It sits above or beside an answer that names brands and cites sources. The AirOps guide to AI advertising makes the same point: the useful view is where sponsored and organic placements meet on the same prompt.
If a competitor's ad appears and your brand is also named in the organic answer, that's a different situation from an ad that appears when you're completely absent. In the second case the ad is the only way that rival gets seen, and you have an organic visibility problem to fix first.
Measure these together:
- Is your brand mentioned in the answer, and where?
- Which sources are cited, and are any yours?
- Which ad appears, and who bought it?
What the ad data looks like in a tool
When picking a tracker, check that it captures the actual ad fields: headline, description, advertiser, landing page, rank, and last-seen date. Finseo, for instance, reads out each placement with rank and how many times it ran.
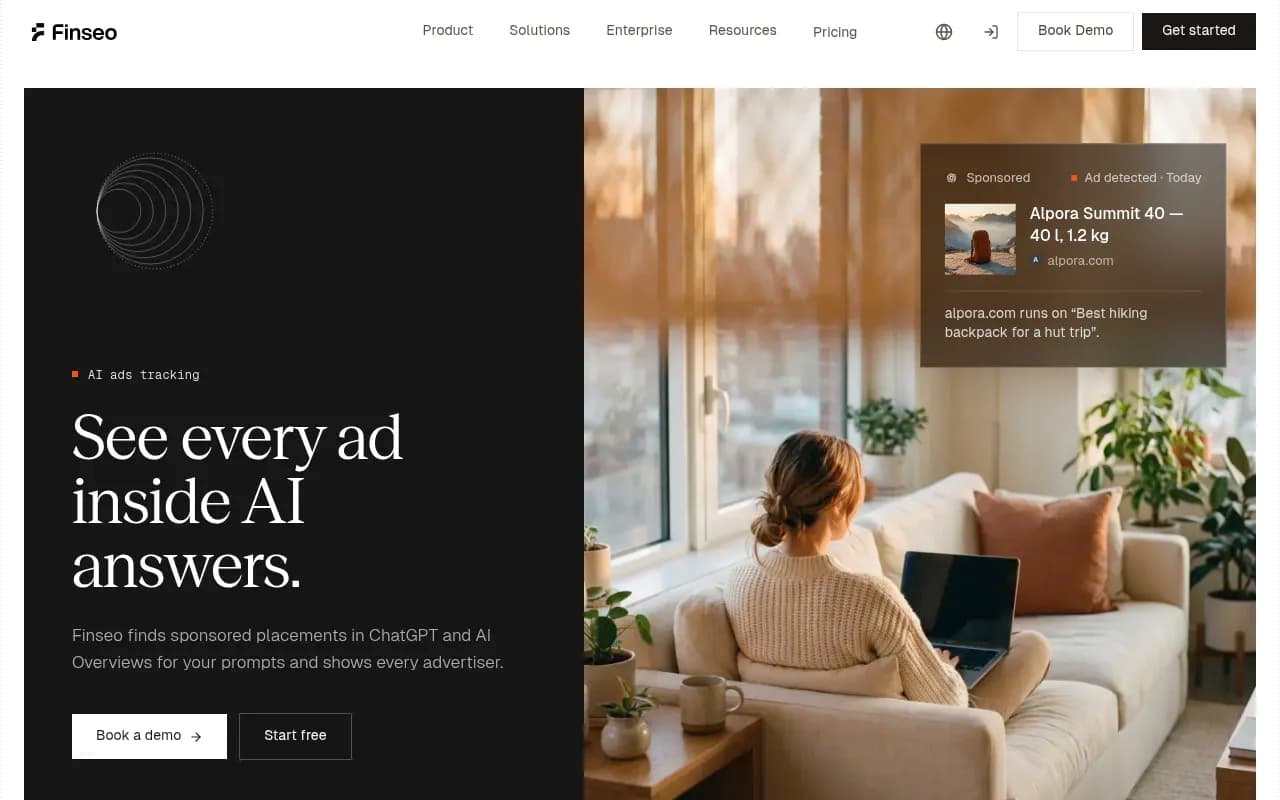
Here's a rough way to think about the options:
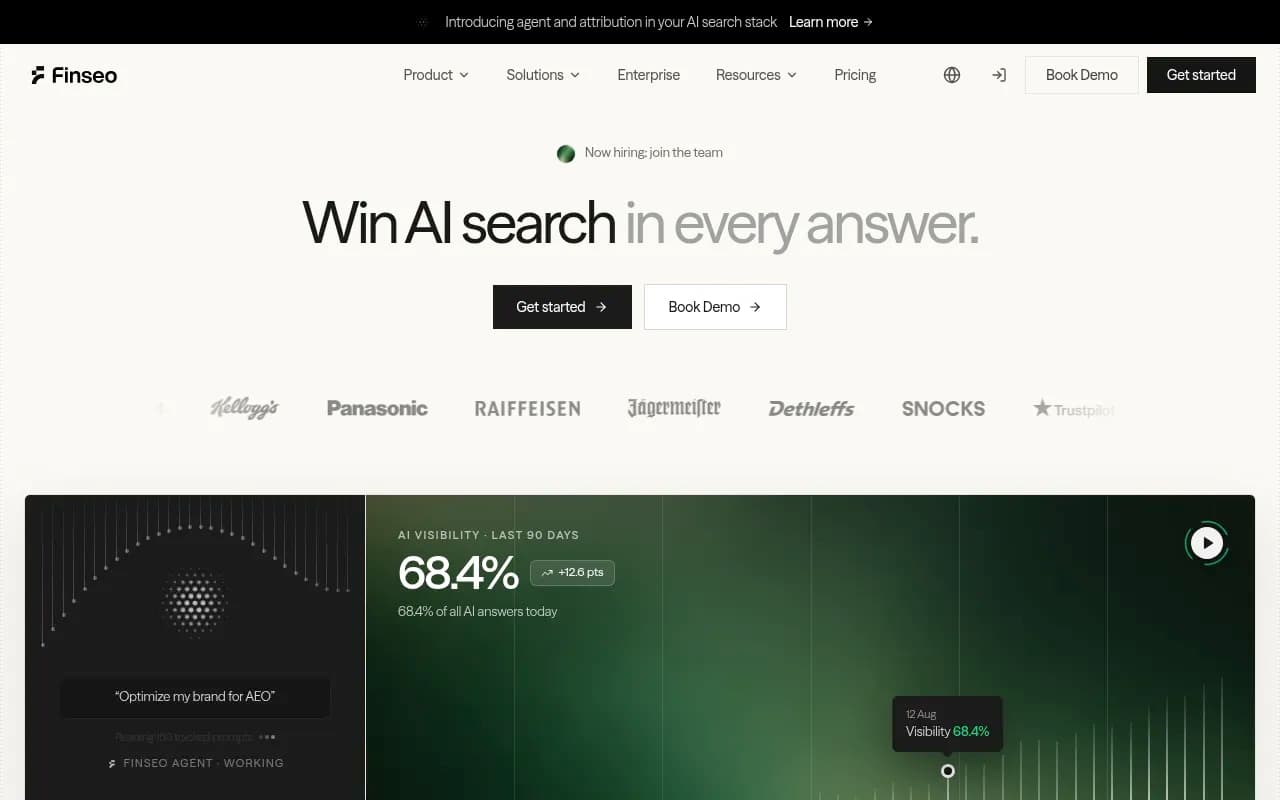
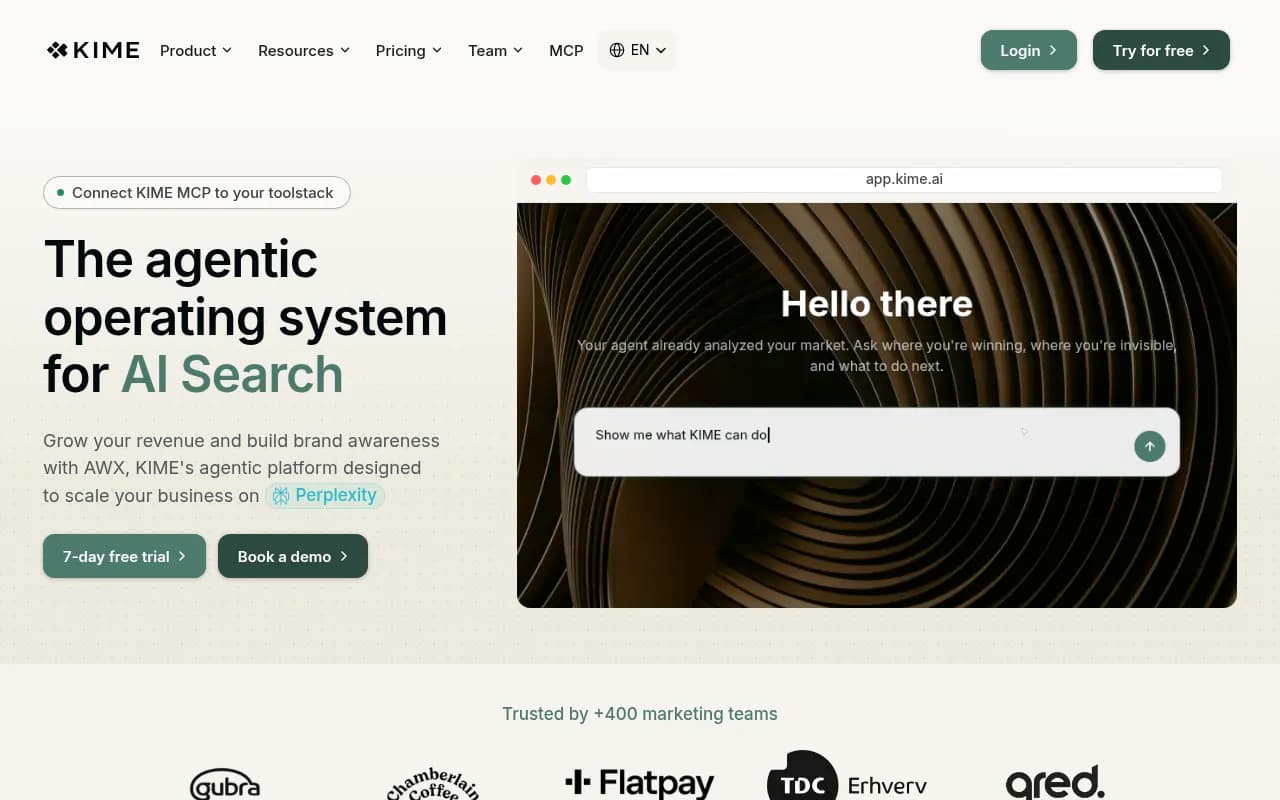
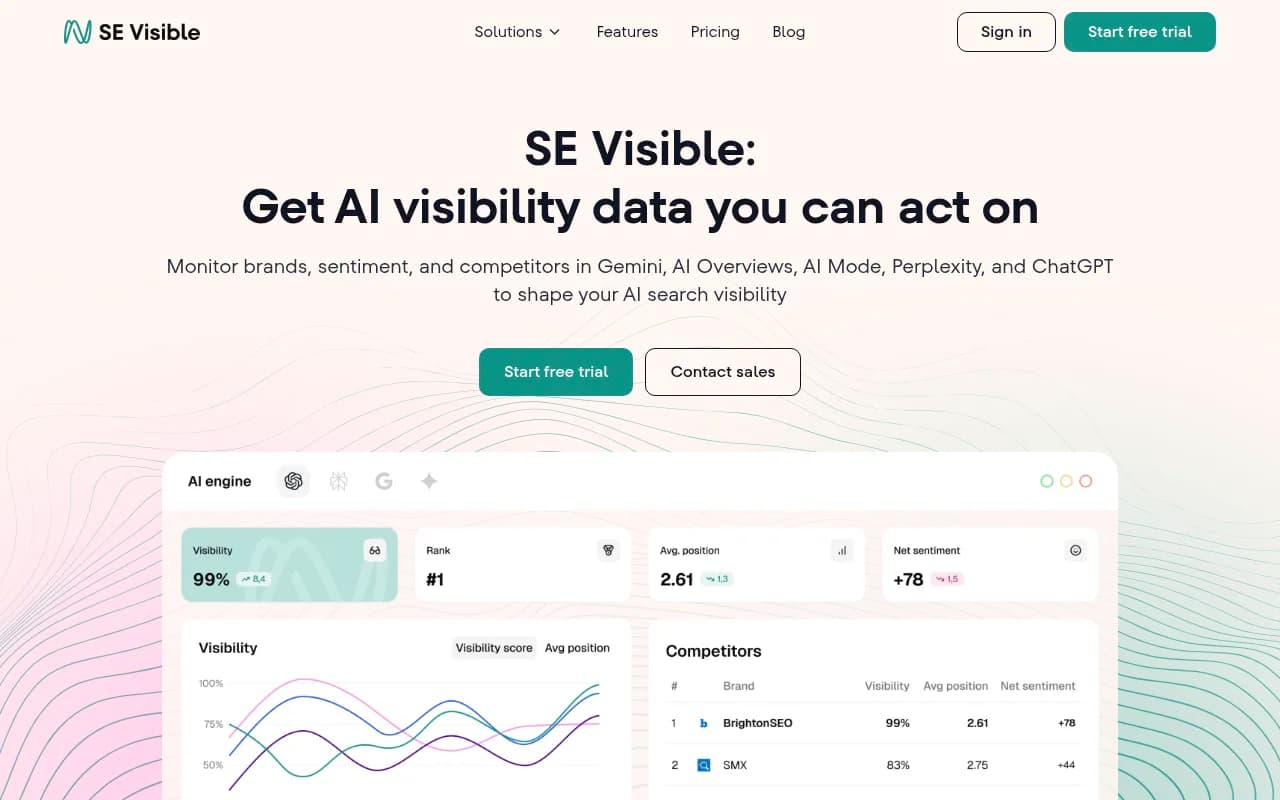
| Tool | Ad tracking angle | Also covers organic visibility | Best for |
|---|---|---|---|
| Promptwatch | Ads Radar: advertisers, ad copy, claims, landing pages by ad or by prompt | Yes, plus crawler logs, visitor analytics, content | Teams that want ads, citations, and traffic in one place |
| Finseo | Ad readout for ChatGPT and AI Overviews | Yes | Teams focused on AI Mode and Overviews |
| KIME | Ad insights across engines | Yes | Multi-engine tracking |
| SE Ranking / SE Visible | Study data plus visibility toolkit | Yes | Existing SE Ranking users |
Please verify feature availability and pricing on each vendor's site before buying. I did not check current pricing for these tools.
Where Promptwatch fits
Promptwatch has a dedicated Ads Radar that shows which advertisers bid on your prompts, their ad copy, claims, and landing pages, viewed by ad or by prompt. It sits next to prompt tracking, citation data, crawler logs, and AI visitor analytics, which is what you need to avoid mistake 8. Ads Radar is on Business, every agency plan, and Enterprise; confirm current details at promptwatch.com/pricing. It also runs against the real ChatGPT interface rather than only the API, which matters because ads only appear in the user-facing product.
If you want to see the broader picture of how ChatGPT sources its answers, Promptwatch Data publishes regularly updated reports, including how often ChatGPT shows ads.
A simple tracking setup that avoids these mistakes
- Build a fixed prompt set split into organic, brand-specific, and competitor-comparison groups. Don't change it without noting the date.
- Run it daily, not once. Daily is the minimum for ad data, given how much the rate moved in the 90-day window.
- Report ad rate per prompt type, not share of all ads by type.
- Log advertisers per segment and review them weekly.
- Track ChatGPT, AI Overviews, and AI Mode separately.
- Pair ad data with your own brand mentions and citations on the same prompts.
- Tag links and count utm_source=chatgpt.com as ChatGPT traffic.
- Label every external stat with its source, time window, and denominator.
A quick sanity checklist before you present ad data
| Question | Red flag if the answer is no |
|---|---|
| Did I sample across multiple days? | One-day snapshot, outlier risk |
| Did I separate ad rate from advertiser share? | Mixing market conditions with competition |
| Did I hold the prompt set constant? | Chart movement is your own doing |
| Did I split by prompt type? | Conquesting on brand terms is hidden |
| Did I separate ChatGPT from Google surfaces? | Blended number means nothing |
| Do I know each source's denominator? | Studies get compared unfairly |
| Is AI traffic tagged? | Ad ROI lands in Direct |
Final thought
The ad rate itself will keep shifting. ChatGPT went from zero ads to a 43.9% peak day in about five weeks, and nobody outside OpenAI knows where it settles. What you can control is whether your measurement holds still while the platform moves. Fix the prompt set, sample over time, split by segment, and keep ads next to the organic answer. For more tools in this space, the GEO software directory at bestgeosoftware.com is a good place to compare options.