Key takeaways
- A peak citation dashboard shows when AI engines cite your pages most, which pages drive those peaks, and how long the lift lasts. It is a trend view, not a one-day snapshot.
- You need three data layers: citation and mention data from an AI visibility platform, Google Search Console and Bing data, and GA4 for traffic and conversions.
- Segment citations by prompt intent and content type. Promptwatch Data shows the mix differs a lot between commercial, informational, and branded prompts.
- Watch out for mismatched date ranges. Period-over-period charts break when one period is 7 days and the other is 30.
- Annotate content releases and model changes directly on the timeline, or the peaks will be impossible to explain later.
What a peak citation dashboard is
Most SEO dashboards answer "how many clicks did we get?" A peak citation dashboard answers a different question: when did AI engines start citing us, which pages caused it, and did it last?
That last part matters. Citations are volatile. Google tests new answer layouts, ChatGPT changes how it searches, and a page that gets cited heavily one week can vanish the next. If you only report a monthly total, you miss the shape of the curve. Peaks, ramp-ups, and decay are where the useful decisions come from.
So the dashboard has one job: make the shape visible. Everything else (revenue overlays, competitor comparisons, page tables) supports that.
Why the shape of citations matters
Content types behave very differently. In Promptwatch Data's content half-life report, which tracked every page ChatGPT cited on July 6, 2026 for 90 days, landing pages and docs stayed cited longest, while news lost half its pages within about 36 days. If your dashboard only shows a total, a news-heavy site and a docs-heavy site can look identical this month and wildly different next quarter.
The mix also changes by intent. For the week of Sep 28 to Oct 4, 2026, Promptwatch's ChatGPT citation share by content type put product pages at 22.4% of all citations, landing pages at 16.8%, and listicles at 13.6%. Split by intent, commercial prompts leaned harder on product pages (26.0%) and landing pages (20.6%), while informational prompts gave how-tos 10.7% and docs 8.5%. Branded prompts looked different again, with reviews at 5.6% and FAQ pages at 4.8%.
The takeaway for your build: a single "citations" number hides most of the story. Plan for at least two breakdowns from day one, prompt intent and content type.
Step 1: Decide what you are measuring
Before touching Looker Studio, write down the metrics. A reasonable set for a peak citation view:
- Citations per day, by AI model
- Citation share (your citations as a share of all citations on your tracked prompts)
- Unique cited URLs per week
- Top cited pages, with first cited date
- Citation decay: how many pages cited in week one are still cited in week eight
- AI-referred sessions and conversions from GA4
- Search Console clicks and impressions for the same pages
Keep the list short. Every extra metric is another chart someone has to maintain.
Step 2: Pick your data sources
Looker Studio does not know anything about AI citations on its own. You have to bring the data in. There are three layers.
Layer 1: citation and mention data
This is the hard one, because Google's own tools do not give you ChatGPT or Perplexity citations. You need a platform that runs prompts against the real AI interfaces and logs the sources. Options with export or connector routes include Promptwatch, Profound, Otterly.AI, and Peec AI. For a wider list, the GEO software directory at bestgeosoftware.com and the AI rank tracking directory at ai-rank-tools.com are useful starting points.
Promptwatch is an end-to-end AI visibility platform with a built-in Looker Studio connector, Looker Studio is available from the Professional plan upward, and it also exposes a REST API and MCP server if you would rather pipe data into BigQuery or Google Sheets. It tracks citations across ChatGPT, Google AI Overviews, AI Mode, Gemini, Perplexity, Copilot and others, and it classifies each citation by content type and source type, which saves you building that logic yourself.
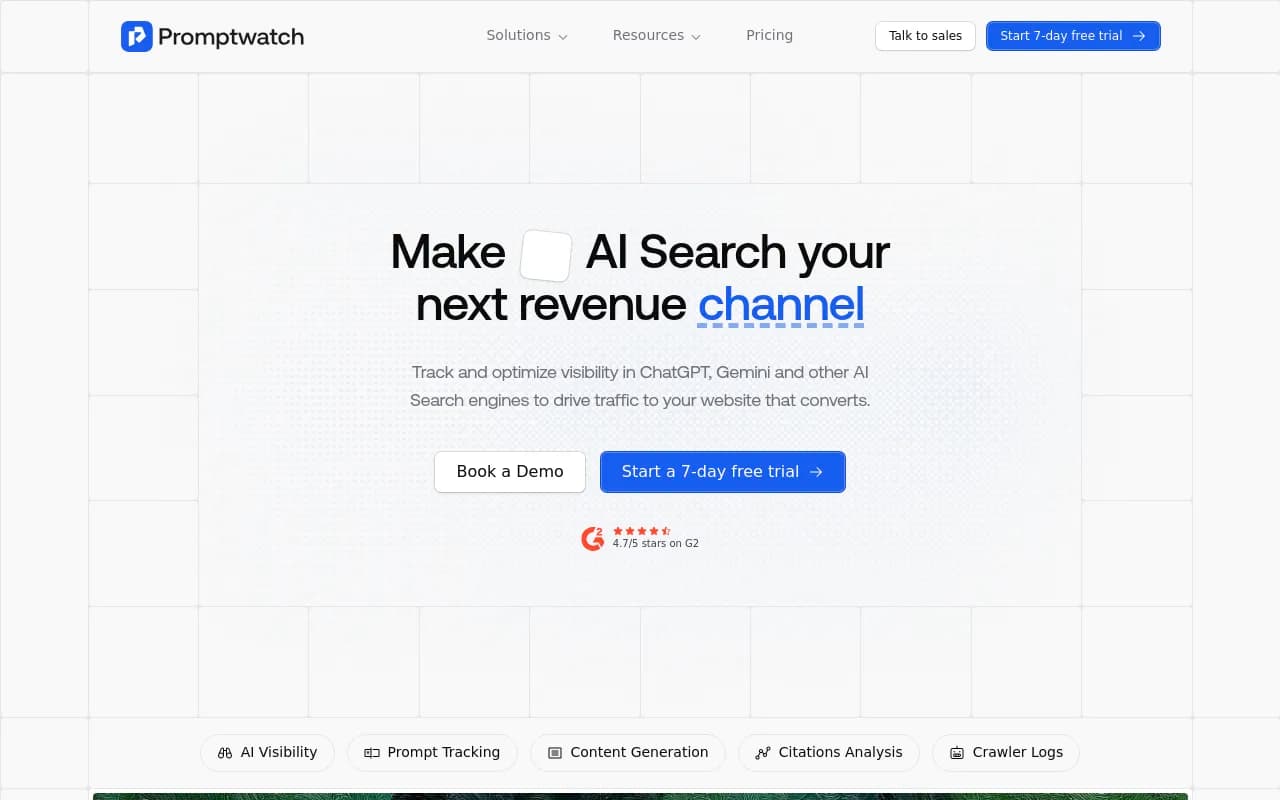
Pricing and plan limits change, so confirm at promptwatch.com/pricing before you commit.
Other platforms in the same space, if you are already using one:
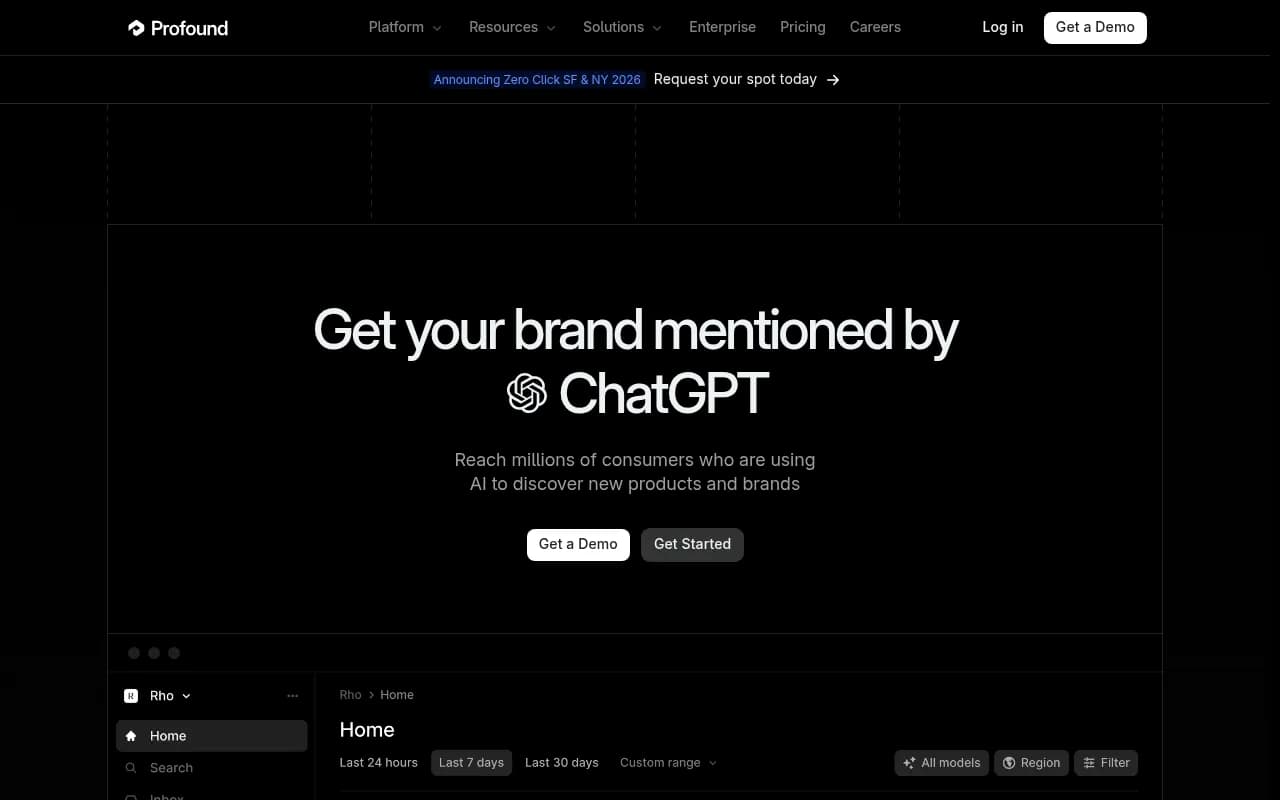
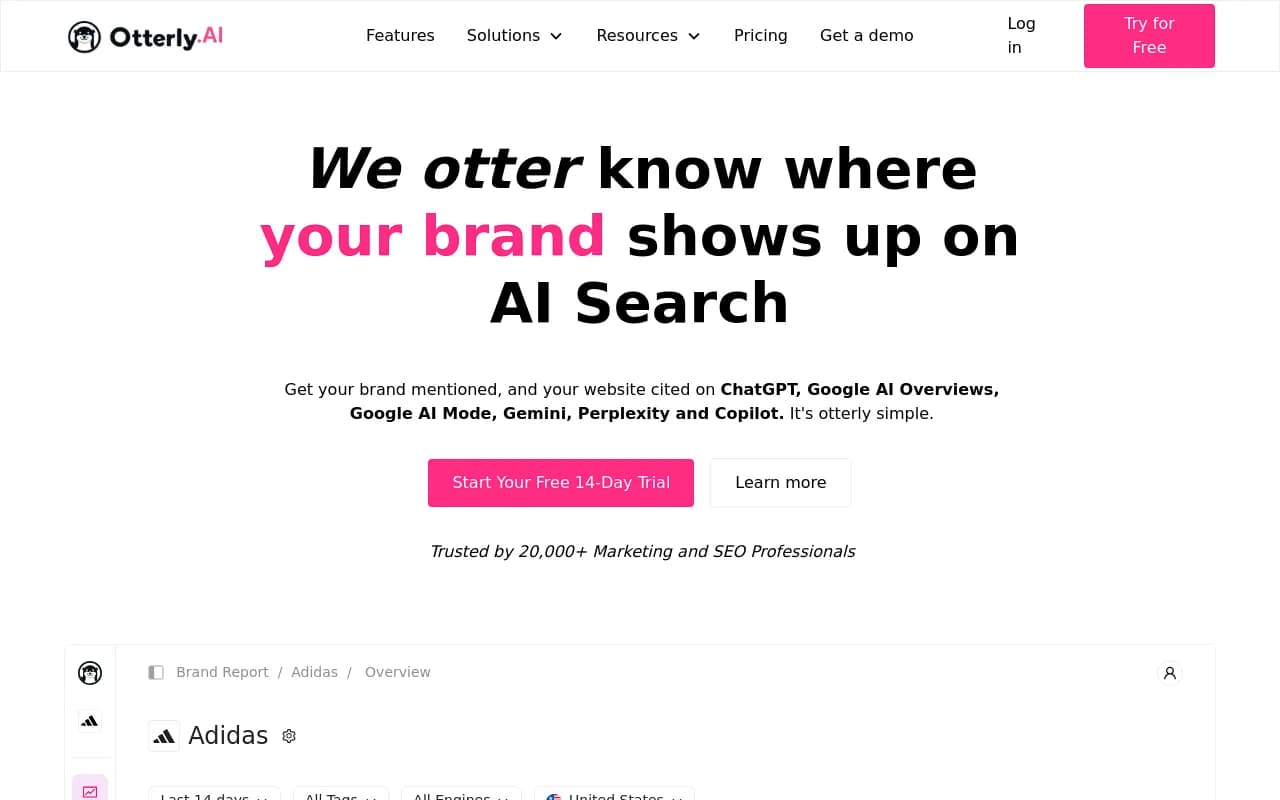
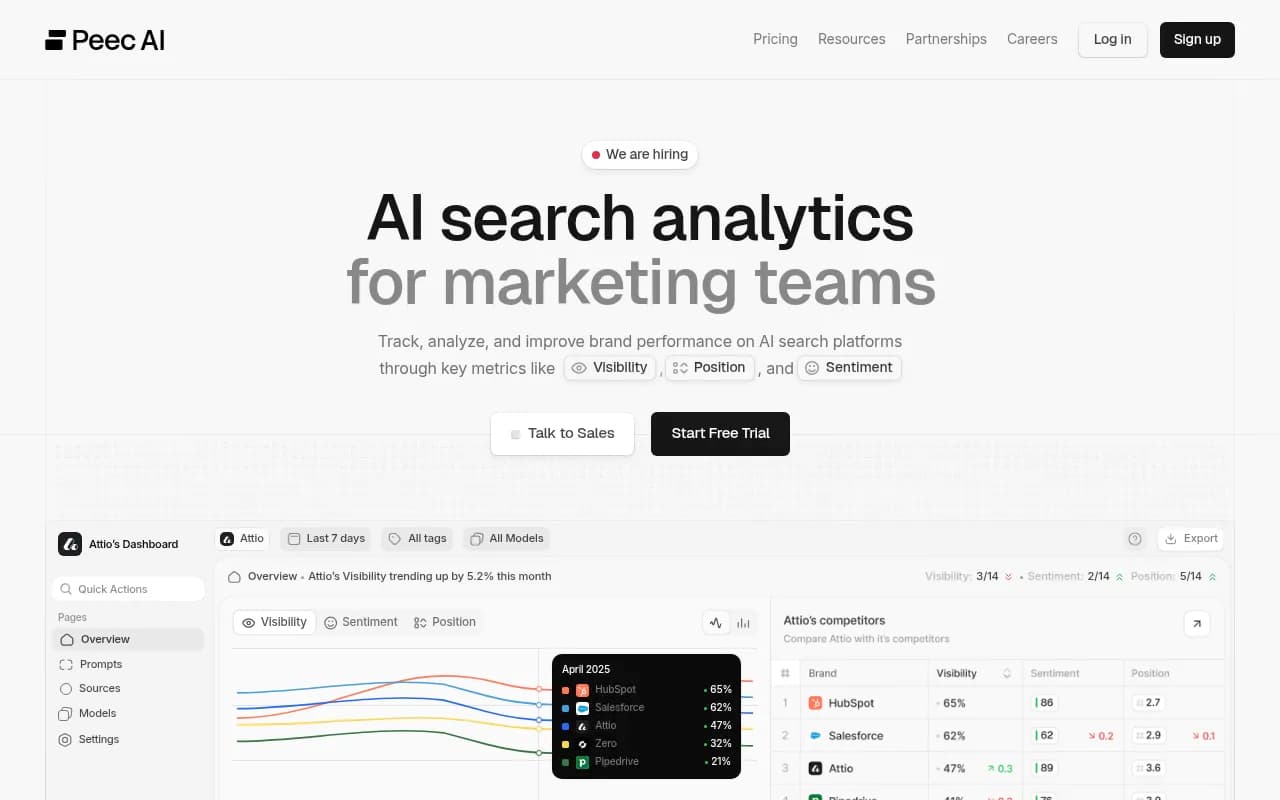
Whatever you choose, check three things before building: can it export per-citation rows (date, prompt, model, cited URL), does it keep history, and does it tag prompts by intent or topic. Without per-citation rows you cannot compute peaks.
Layer 2: Search Console and Bing
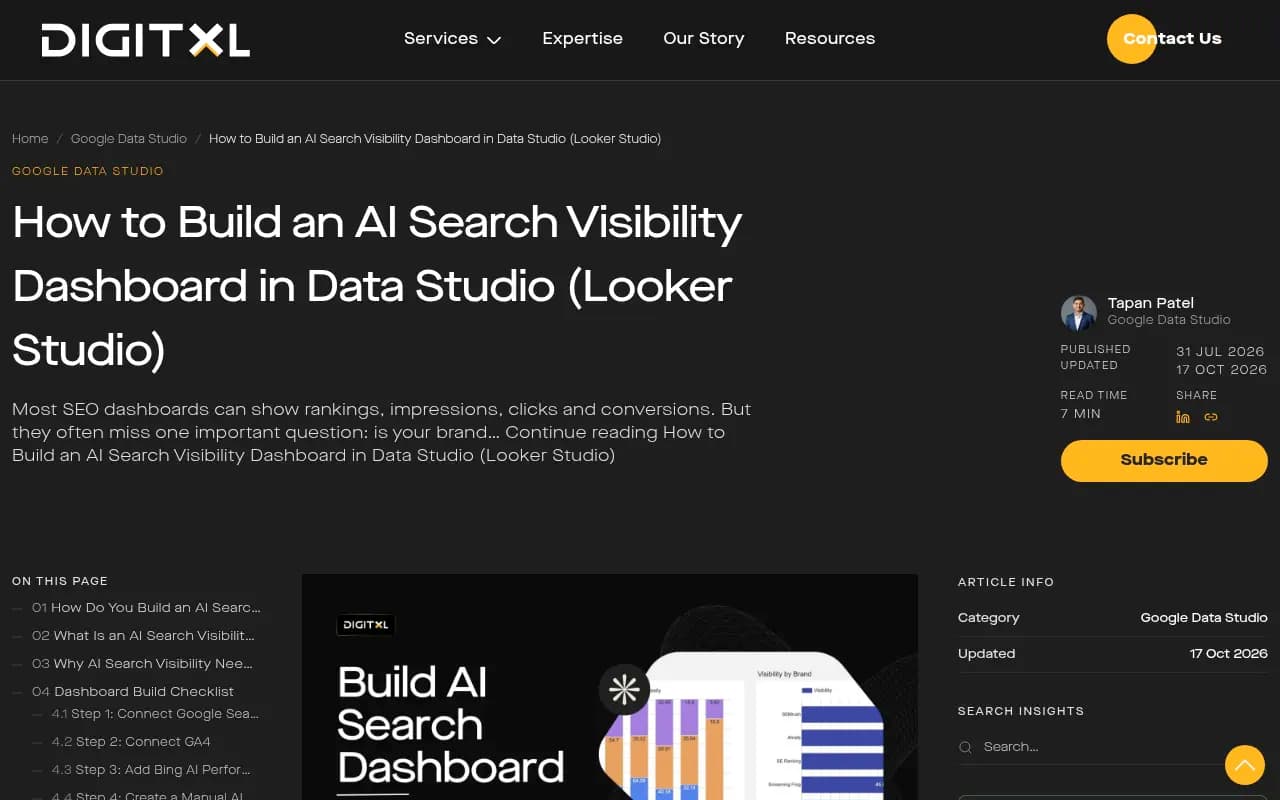
Search Console gives you per-page clicks and impressions, which tell you whether a page that earns citations also performs in classic search. Add Bing Webmaster Tools data if you can, since Copilot draws on Bing's index. The DIGITXL guide on building an AI search visibility dashboard in Looker Studio follows the same order: Search Console, GA4, Bing AI performance data, a manual prompt tracker, then the dashboard pages.
One caution. A BlogSEO template page claims Search Console exposes AI Overview search appearance types through the Search Analytics API. I could not verify that against Google's documentation, so do not build a core metric on it until you have confirmed it in your own property. Treat AI Overview impressions from Search Console as unverified, and rely on a tracking platform for AI Overview citations.
Layer 3: GA4
GA4 supplies sessions, engagement, and conversions. Create a channel group or a single filter that isolates AI-referred traffic by source (chatgpt.com, perplexity.ai, gemini.google.com, copilot.microsoft.com, claude.ai and so on). Be aware that referrers are unreliable. According to Promptwatch's product notes, ChatGPT stopped sending a referrer on October 8, 2026, so visits tagged utm_source=chatgpt.com need to be counted explicitly. Expect some AI traffic to land in Direct no matter what you do. See Promptwatch's academy guide on attributing AI traffic for a fuller treatment.
Step 3: Get the data into Looker Studio
There are four realistic routes, from easiest to most flexible:
| Route | Setup effort | Best for | Watch out for |
|---|---|---|---|
| Native connector (for example Promptwatch's Looker Studio connector) | Low | Teams that want a dashboard this week | Field names and limits are set by the vendor |
| Google Sheets export | Low | Small prompt sets, manual trackers | Manual refresh, row limits |
| BigQuery via API or scheduled export | Medium | Agencies, multi-client reporting | Needs someone comfortable with SQL |
| Community connector (Supermetrics and similar) | Medium | Blending ad and analytics sources | Extra monthly cost |
For most teams, I would start with the native connector for citation data and the free Search Console and GA4 connectors for everything else. Move to BigQuery only when you hit row limits or need to join data from several clients.
If you want to automate exports from tools without a connector, workflow tools like n8n or Zapier can push API data into Sheets on a schedule.
Step 4: Shape the data for peak analysis
The model matters more than the charts. Aim for one table of citation events with these columns:
- date
- ai_model
- prompt_id and prompt_text
- prompt_intent (commercial, informational, branded)
- topic
- cited_url
- content_type
- source_type
- is_own_domain (true or false)
If your platform provides content type and source type, keep them. If not, you can approximate content type from URL patterns with a CASE statement, though it will be rougher.
Calculated fields worth creating
Citation count per day:
COUNT(cited_url)
Own citation flag:
CASE WHEN REGEXP_MATCH(cited_url, "^https?://(www\\.)?yourdomain\\.com") THEN 1 ELSE 0 END
Citation share:
SUM(own_citation_flag) / COUNT(cited_url)
Seven-day rolling average (use a time series chart with the comparison option, or compute it in BigQuery for accuracy). Rolling averages make peaks easier to spot because daily numbers are noisy.
Peak flag: compare each day's citations to the 28-day average and flag days above, say, 1.5 times that average. Looker Studio's native calculated fields struggle with window functions, so this is the best case for doing the calculation upstream in BigQuery or Sheets and reading a ready-made peak_flag column.
First cited date per URL:
MIN(date) -- grouped by cited_url
This one powers a "newly cited pages" table, which is the quickest way to connect a content release to a citation lift.
Step 5: Build the dashboard pages
Keep it to four pages. More than that and nobody opens it.
Page 1: overview
- Scorecards: total citations, citation share, unique cited URLs, AI-referred sessions. Each with a comparison to the previous period of the same length.
- A time series of daily citations with a seven-day average line.
- A stacked chart of citations by AI model.
Put the peak flag on this page as a colored marker or a small table of "peak days this period".
Page 2: what gets cited
- Content type breakdown (bar chart), filterable by prompt intent.
- A table of top cited URLs with first cited date, citation count, and last cited date.
- A "newly cited this period" table.
This is where the Promptwatch Data benchmarks earn their keep. If product pages are 22.4% of ChatGPT citations in the benchmark and 3% of yours, you have a gap worth investigating.
Page 3: decay and retention
- A cohort-style table: pages first cited in week N, and how many are still cited in weeks N+1 through N+8.
- A chart of citation count by content type over time.
This page answers "should we refresh old posts or publish new ones?" Given that news decays within weeks and landing pages and docs last far longer, you will probably find the answer differs by content type.
Page 4: traffic and revenue
- GA4 AI-referred sessions and conversions by source.
- A blended table joining cited URL to GA4 landing page: citations, sessions, conversions.
- Search Console clicks for the same pages alongside.
Blend on the landing page path, not the full URL, because Looker Studio blends are picky about exact string matches. Strip the protocol and domain with REGEXP_EXTRACT in a calculated field on both sides before joining.
Be honest about what this page proves. A page that gets cited and also gets AI-referred sessions is a good sign, but correlation is not causation. Citations influence people who never click, and some AI traffic is invisible to GA4. Present it as directional.
Step 6: Segment by social and platform sources
If you track citations to your own social profiles or care about third-party platforms, add a source-type filter. The platform mix differs enormously by engine. In Promptwatch's social media citations report for November 2026 (Oct 11 to Nov 9), social platforms made up 13.16% of Google AI Overviews citations, 1.94% of Perplexity's, and 0.64% of ChatGPT's. Inside AI Overviews, YouTube alone was 6.71%.
That means a blended "all AI" citation share will mostly reflect how many of your prompts run on AI Overviews. Always show citations by model. A flat total averages away the differences that explain your results.
Pitfalls that skew the numbers
Uneven comparison periods
The same Promptwatch social report is a good cautionary example: the November figures cover 30 days, while the October comparison covers only 7 (Sep 28 to Oct 4). The two are not like-for-like. In Looker Studio, use the date range comparison control with "previous period" so both ranges have the same length, and label the range on every chart.
Prompt set changes
If you add 50 prompts in the middle of the quarter, citations jump and nothing about your content changed. Track the prompt count as a line on the chart, or normalize to citations per prompt. Better still, annotate the day you changed the set.
Model and engine changes
The underlying engines change under you. Promptwatch Data documented that ChatGPT began using the site: operator at scale on August 8, 2026, jumping from about 0.4% to about 17% of fan-out queries (report), and that reddit.com's share of ChatGPT citations fell from roughly 4% to 0.5% on August 14 (report). A sudden dip or peak may be the engine, not you. Keep an annotations sheet and add it as a data source, with a date and a note per row.
Counting rules
Decide whether a page cited in five responses counts as one citation or five. Promptwatch's content type report counts it once per citation, so five. Pick a rule, write it on the dashboard, and do not change it silently.
Crawl access problems that look like content problems
If a page is never cited, check whether AI crawlers can even reach it. IP-verified AI crawler logs (Promptwatch's Agent Analytics does this, as do tools like DarkVisitors) separate access problems from content problems. If you have the data, add a crawler-hits column to the top-pages table.
Layout and design tips
- Put the time series first. Everyone's eye goes there.
- Use one color per AI model and keep it consistent across pages.
- Limit each page to six or seven charts.
- Add a text box with definitions: what counts as a citation, which prompts are tracked, which countries and languages.
- Add a date-range control and a model filter at the top of every page, and a prompt intent filter on pages 1 and 2.
- For client-facing versions, hide raw tables and lead with scorecards and a two-line commentary box. Surferstack has a full guide on building a client-facing AI visibility dashboard in Looker Studio if reporting is the main use.
If you want to compare ready-made options before building, the Surferstack roundup of Looker Studio templates for AI search visibility reporting covers several starting points.
Where a dashboard stops and tooling starts
A dashboard tells you a peak happened. It does not write the next page or tell you which gaps to fill. That is the difference between a reporting layer and an optimization platform. Promptwatch pairs the citation data with content gap analysis, a Content Agent that writes and publishes pages, and page-level tracking that shows whether the new page got crawled, cited, and clicked. If you are an agency running this for several clients, its agency plans allow unlimited projects, and you can start with the 7-day free trial or the free AI visibility report to see what data you would be working with.
If you would rather keep tools separate, pair any tracker with Looker Studio and use the dashboard purely for reporting.
A quick build checklist
- Write down the metrics and the counting rules.
- Choose an AI visibility source that exports per-citation rows with history.
- Connect Search Console, GA4, and optionally Bing.
- Create the citation events table with intent and content type.
- Add calculated fields: own citation flag, citation share, rolling average, peak flag, first cited date.
- Build four pages: overview, what gets cited, decay, traffic and revenue.
- Add an annotations sheet for releases, prompt set changes, and engine changes.
- Check that every comparison uses equal-length periods.
- Review monthly and prune any chart nobody looked at.
Final thought
Start smaller than you think you should. One page with a daily citation line, a model breakdown, and a newly cited pages table will teach you more in a month than a twelve-page report nobody maintains. Add the decay view once you have eight weeks of history, because that is when it starts to say something real.