Key takeaways
- Use three tabs: a prompt list, a response log (one row per run), and an ad detail log (one row per sponsored placement).
- Keep a separate "ad present" flag on every response row. Your ad rate needs a clean denominator, and ad detail rows alone can't give you one.
- Tag every prompt as organic, brand-specific or competitor comparison, and report the ad rate per segment.
- Run each prompt repeatedly over several days. A single run can land on an outlier day.
- A spreadsheet works fine for roughly 20 to 50 prompts. Past that, manual capture is the bottleneck and a monitoring tool pays for itself.
Why log AI ads in a spreadsheet at all
Sponsored placements in ChatGPT are new enough that most teams have no history. Nobody can tell you who bought your prompts last month, because nobody wrote it down.
A spreadsheet fixes that cheaply. It also forces you to decide what you actually care about: which advertisers show up, on which prompts, how often, and whether the rate is moving.
Here is the context that shapes the design. Promptwatch Data's ChatGPT ads report covers May 20 to August 17, 2026. ChatGPT served no ads until May 27, when they appeared in 1.69% of responses. On July 1 the rate jumped past 30% and mostly stayed there, with a daily peak of 43.9%. Across the full 90 days, ads appeared in an average of 20.1% of responses, counting only responses where ChatGPT searched the web, returned at least one citation and completed ad extraction.
Two things follow. The rate changes in steps, so you need a date on everything. And the denominator matters, so you need to record which responses were eligible.
The three-tab structure
Resist the single giant sheet. One row per ad sounds simple, but it breaks the moment a response has no ad (no row, so no denominator) or two ads (duplicated response data).
| Tab | One row equals | Purpose |
|---|---|---|
| Prompts | One tracked prompt | Master list with type, topic and market |
| Responses | One run of one prompt on one model | Records whether an ad was present and whether the run was eligible |
| Ads | One sponsored placement | Advertiser, creative, landing page, rank |
The Ads tab links back to the Responses tab through a response ID. That one key is what lets you count ads per response and ad rates per prompt without double counting.
Tab 1: Prompts
Columns:
- Prompt ID (P001, P002 and so on)
- Prompt text
- Prompt type: organic, brand-specific or competitor comparison
- Topic or product line
- Country and language
- Persona, if you test buyer personas
- Owner
The prompt type column is the one people skip and then regret. Promptwatch Data's 90-day report shows ad-bearing responses split roughly 73% organic, 18% brand-specific and 9% competitor comparison. The report is explicit that this mix reflects prompt volume: add more organic prompts to a monitor and their share rises even if nothing changed at OpenAI. It shows where ads appeared, not how likely each type is to trigger one. So compute the ad rate per segment, not just a share of all ads.
Tab 2: Responses
Columns:
- Response ID (R0001)
- Run date
- Run time and timezone
- Prompt ID
- Model or surface (ChatGPT Search, Google AI Overviews, Google AI Mode, Perplexity, Gemini, Copilot)
- Logged in or out, plus device (these can change what you see)
- Web search triggered (Y/N)
- Citations returned (Y/N)
- Eligible (formula: both of the above are Y)
- Ad present (Y/N, only meaningful when eligible)
- Ad count
- Screenshot link
- Run number within the batch (1 to 5)
The Eligible column mirrors the methodology above. If ChatGPT answered from memory without searching, an absent ad tells you nothing. Exclude those runs from the denominator.
Tab 3: Ads
This is the detail log. A good column model is what ad tracking tools record per sponsored placement. Finseo's AI ads tracking page lists headline, description, advertiser, landing URL, click ID, rank and date seen, and that is a sensible field list to copy.

Columns:
- Ad ID
- Response ID (the link to Tab 2)
- Date seen (pulled from Responses by lookup)
- Advertiser name
- Advertiser domain
- Headline
- Description
- Landing URL
- Click ID or tracking parameter
- Rank (1 is the first sponsored slot)
- Placement: above the answer, alongside, or in a carousel
- Product or offer advertised
- Notes
Strip the click ID off the landing URL into its own column. You want the clean URL for grouping and the full one as evidence.
Formulas that do the work
The point of the structure is that summaries become one-liners. Assuming the tabs are named Prompts, Responses and Ads and the data sits in Excel tables or named ranges, these are the ones worth building.
Eligible flag
=IF(AND([@[Web search]]="Y",[@[Citations]]="Y"),1,0)
Ad rate per prompt
=IFERROR(COUNTIFS(Responses[Prompt ID],A2,Responses[Eligible],1,Responses[Ad present],"Y")/COUNTIFS(Responses[Prompt ID],A2,Responses[Eligible],1),"")
Ad rate per prompt type
Add a Prompt type column to Responses using a lookup, then:
=COUNTIFS(Responses[Prompt type],"organic",Responses[Eligible],1,Responses[Ad present],"Y")/COUNTIFS(Responses[Prompt type],"organic",Responses[Eligible],1)
Ads per advertiser
=COUNTIF(Ads[Advertiser domain],A2)
For appearances, count rows in Ads for that advertiser. For distinct creatives, count unique headlines (UNIQUE plus COUNTA in Excel 365 or Google Sheets).
Weekly ad rate
Add a week-start column to Responses (=A2-WEEKDAY(A2,2)+1) and run the same ratio per week. This is the chart that shows step changes.
The advertiser leaderboard
The most useful summary tab is a leaderboard of who buys your prompts. Finseo's dashboard shows the shape well: advertiser, ads, appearances and share, for example one advertiser at 6 ads and 41 appearances for a 32.8% share over 30 days and 14 prompts. Copy that layout.
| Advertiser | Distinct ads | Appearances | Share of appearances | First seen | Last seen |
|---|---|---|---|---|---|
| advertiser-a.com | 6 | 41 | 32.8% | Oct 2 | Oct 9 |
| advertiser-b.com | 4 | 28 | 22.4% | Oct 3 | Oct 9 |
Share is appearances divided by total appearances in the window. Add a window selector cell (last 7, 30 or 90 days) and drive the COUNTIFS with a date threshold, so the leaderboard recalculates when you change it.
One caution. Appearances are inflated by repeated runs of the same prompt. If you run a prompt five times and one advertiser shows every time, that is five appearances. Fine for comparison within your own sheet, but don't present it as a market-wide number.
Sampling rules that keep the data honest
A template is only as good as the discipline behind it.
Run each prompt more than once
Promptwatch's own advice from the ads report is to check ad visibility across several days before drawing conclusions, because a single run can land on an outlier day. I would go further: five runs per prompt per batch, spread over at least three days, then report the average.
Fix your variables
Pick one location, one language, one logged-in state, and write them in the Responses tab. Change one at a time and log the change. Otherwise a rate shift might just be you switching accounts.
Watch for step changes
The rate moved sharply on May 27 and again on July 1, 2026. Add a notes column on the weekly chart and annotate anything that looks like a jump. Platform rollouts, not your prompts, often explain them.
Capture evidence
Screenshot every response that contains an ad and paste the link into the row. Ads are ephemeral. A creative you can't prove existed is useless in an agency report or a conversation with a competitor's legal team.
Building the dashboard tab
Keep it small. Four blocks are enough:
- Ad rate over time (line chart, weekly, all eligible responses)
- Ad rate by prompt type (three bars)
- Top advertisers (leaderboard, with the window selector)
- Prompts with the highest ad rate (top 10 table)
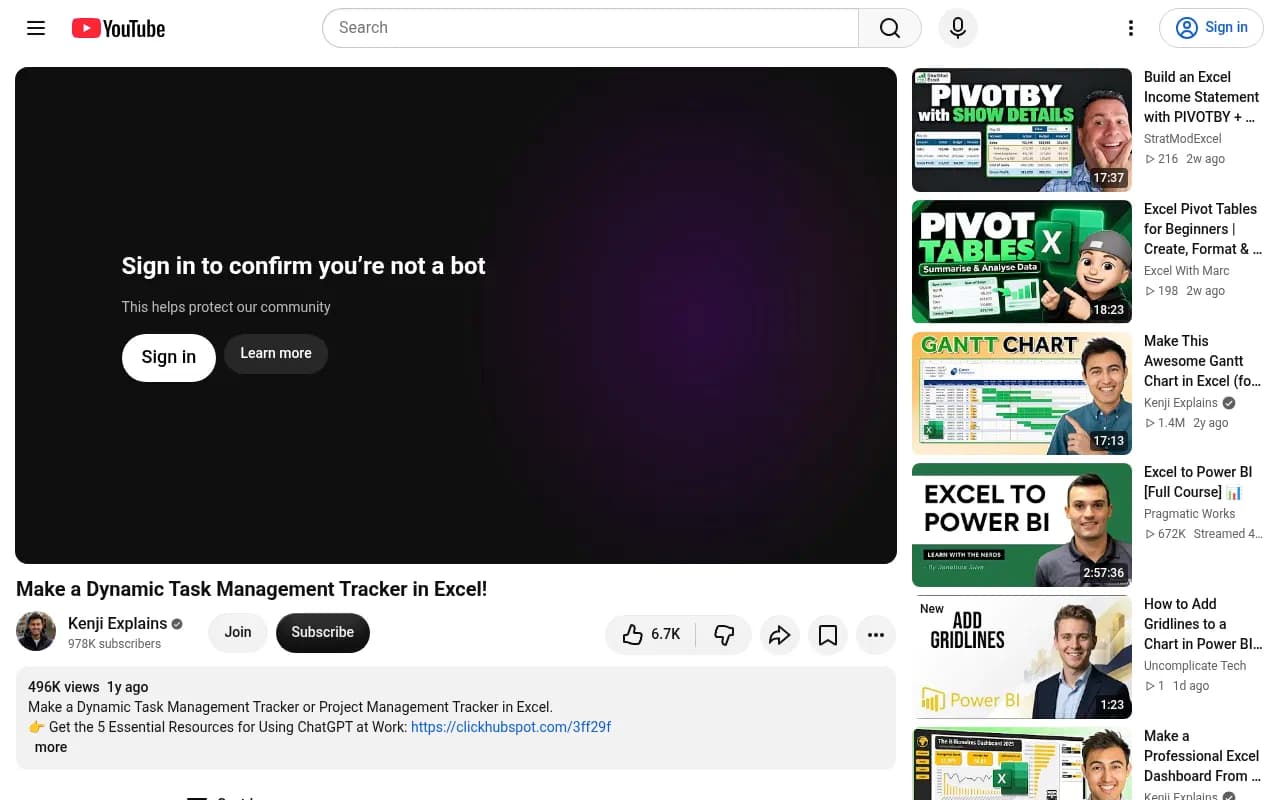
If you want a pattern to follow for the interactive feel, the Excel task tracker walkthrough from Kenji Explains is a decent model for KPI cards at the top and a table below using COUNTIF, TODAY, drop-down lists and conditional formatting.
Use data validation drop-downs for Model, Prompt type, Ad present and Placement. Free-text entry in those columns is how a tracker rots within a month ("ChatGPT", "chatgpt", "Chat GPT").
Google Sheets or Excel
Both work. Sheets is easier if several people log runs, because everyone writes into the same file with no version drift. Excel handles larger logs and structured tables better. If you want a reference for a Sheets build, Groas published a 40-prompt AI visibility tracker in Google Sheets that tracks prompts across ChatGPT, Gemini and Google AI Overviews with multiple runs, and the same discipline applies here.
If you want an LLM to draft formulas, be careful. Excel errors that look correct are the real risk, as the OnlineExcelTraining guide on writing Excel prompts points out: describe the data structure and the logic in words before asking for a formula, then verify the result against a few rows you calculated by hand.
Automating the capture
Most of the effort is not the formulas. It is running prompts and copying results. Two ways to cut it down:
- Workflow tools such as n8n or Zapier can push exported rows from a monitoring tool into a sheet on a schedule.
- A monitoring platform with an API or CSV export can fill the Responses and Ads tabs for you, leaving the sheet as a reporting layer.

When to move beyond the spreadsheet
A sheet is a good starting point and an honest way to learn what you need. It starts hurting when:
- You track more than about 50 prompts, or several markets and models.
- You want hourly or daily runs instead of whenever someone remembers.
- You need to see ads in the real interface, not an API output. User-facing answers can differ from API results.
- Ads are only one of several things you track (citations, sentiment, crawlers, traffic).
Promptwatch is an AI visibility platform with an Ads Radar that shows which advertisers bid on your prompts, their ad copy, claims and landing pages, viewed by ad or by prompt. It is available on Business, every agency plan and Enterprise, and sits next to prompt tracking, citation data and crawler logs. Details are on its ChatGPT ads page, and you can confirm plan limits at promptwatch.com/pricing.
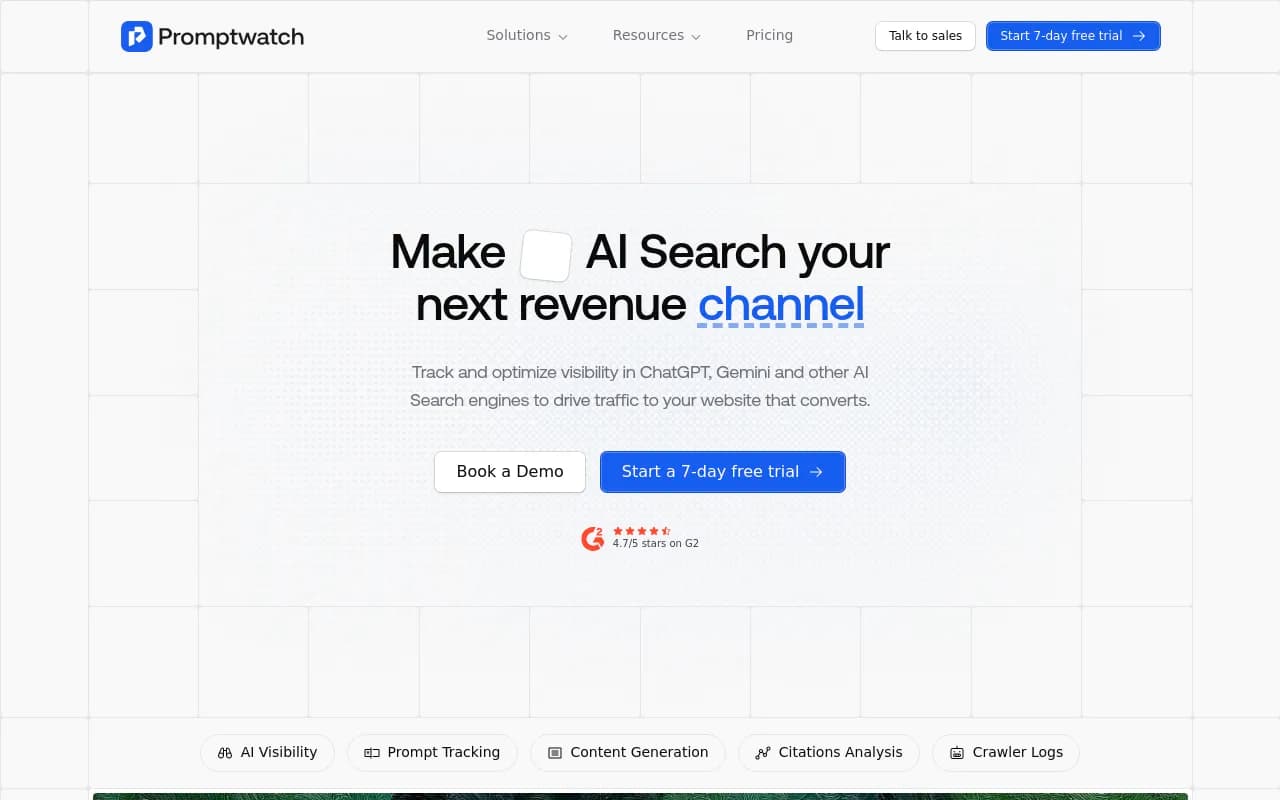
Finseo is a narrower option focused on ads inside ChatGPT and AI Overviews, with an advertiser leaderboard.
Profound is the other name that comes up most often at the enterprise end.
| Approach | Setup effort | Capture | Best for |
|---|---|---|---|
| Manual spreadsheet | An afternoon | Manual runs and screenshots | Under 50 prompts, one market, learning the problem |
| Sheet plus automation | A day or two | Scheduled exports into the log | Teams that already have a data source |
| Monitoring platform with ad tracking | Minutes | Automated runs in real interfaces | Many prompts, models and markets |
If you want a wider look at tools in this category, the GEO software directory at bestgeosoftware.com lists most of them.
Reading the results
A few interpretations I would hold myself to.
A high ad rate on organic prompts and a low one on brand prompts means competitors are buying category terms, not yours. That is a budget question, not a content question.
A competitor showing up on your branded prompts is a different problem. Record the landing page and the claim in the ad. If the claim is false or compares you unfairly, that evidence is what you need.
A flat ad rate with a changing advertiser mix means auction behavior is shifting even though the surface looks stable.
A rate that jumps for every prompt on the same day is almost certainly a platform change. Annotate it and don't act on it.
Quick start checklist
- Create the three tabs and copy the column lists above.
- Add 20 prompts, tagged by type, covering your categories and brand.
- Set data validation on every categorical column.
- Run each prompt five times across three days and log the results.
- Build the eligible flag, ad rate per prompt and per type, and the leaderboard.
- Chart the weekly ad rate and annotate step changes.
- After two weeks, decide whether the sheet is enough or the capture work is eating your time.
The sheet will answer "who is buying our prompts" within a couple of weeks. Whether it is worth scaling is a decision you can make with your own numbers instead of a guess.