Key takeaways
- Six AI visibility tools will give you six different scores for one brand, and that is expected. They differ in prompt sets, collection method, sampling frequency, location, and how a "mention" is counted.
- AI answers are unstable by nature. SparkToro and Gumshoe.ai found a less than 1 in 100 chance that ChatGPT or Google's AI returns the same brand list in any two responses.
- Engines also differ in how many sources they cite, so a raw citation count means something different on each one.
- Compare tools on trend direction and rank order of competitors, not on absolute scores.
- Controlling the inputs (same prompts, same countries, same brand aliases) removes most of the gap before you even look at the dashboards.
A note on what this guide is
The title promises a 60-day, six-tool experiment. I don't have a published dataset from one to hand you, and inventing one would be worse than useless. What I can give you is the sourced explanation for why these tools disagree, plus a test design you can run on your own brand and trust. If you want vendor-reported numbers, run the test. Your brand, your prompts, your result.
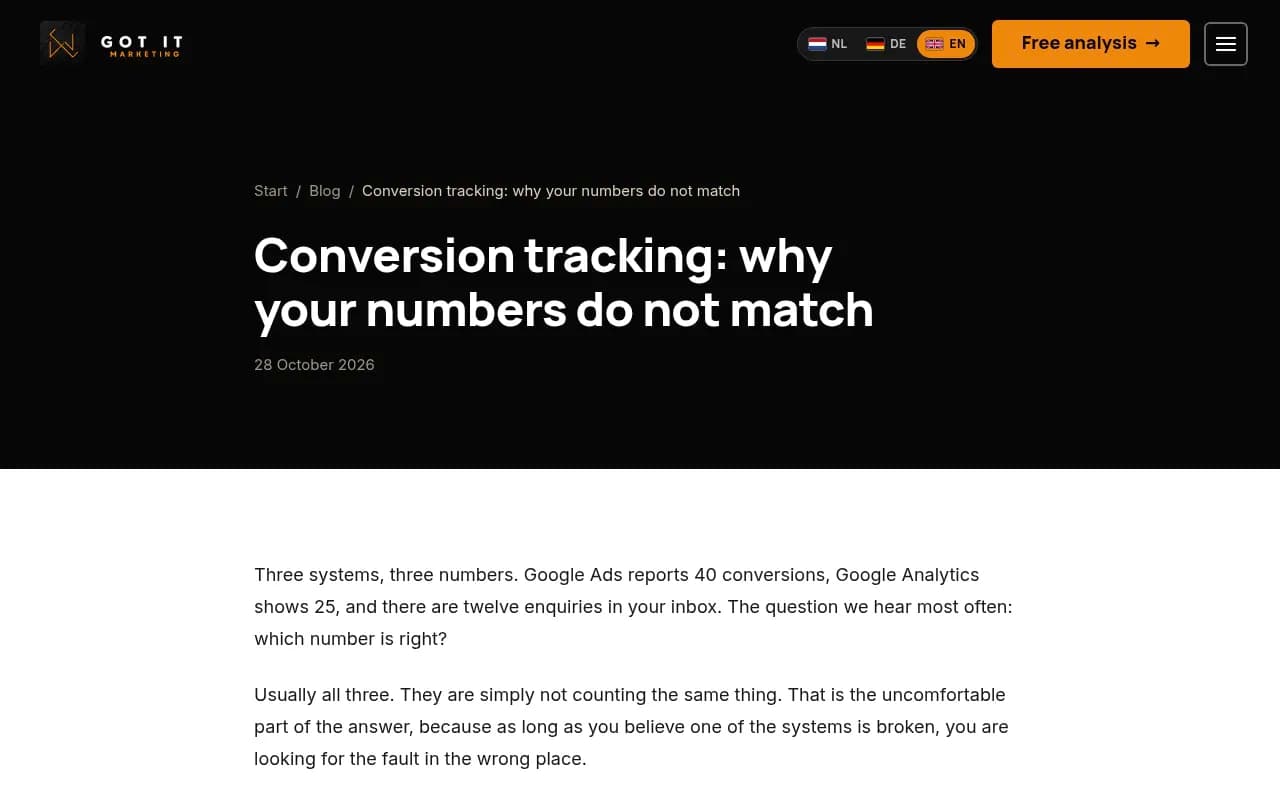
The pattern is familiar from older measurement problems. A marketing agency write-up on conversion tracking describes Google Ads reporting 40 conversions, Analytics showing 25, and twelve enquiries in the inbox. Its answer: usually all three are right, because they are not counting the same thing. AI visibility tools have the same problem, with an extra layer of randomness on top.
The underlying problem: AI answers are not stable
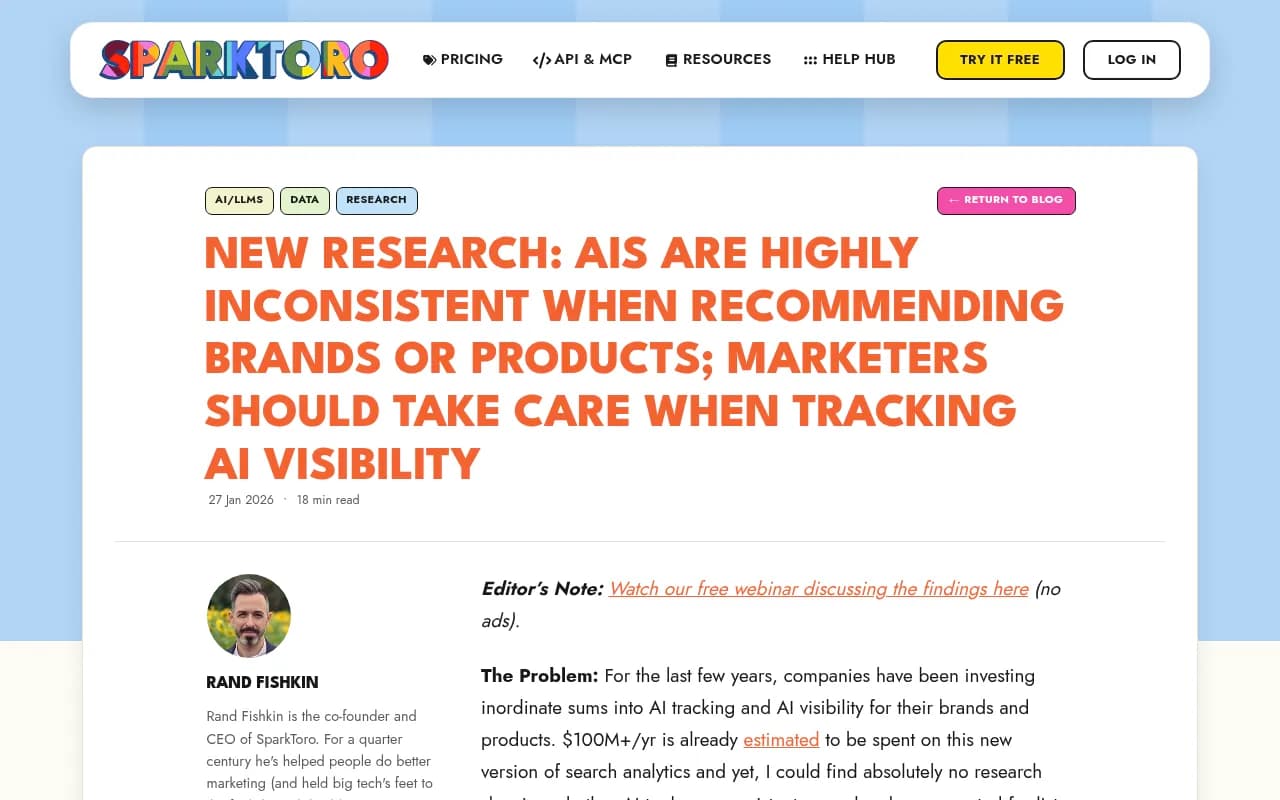
Before blaming any vendor, look at the thing being measured. In January 2026 SparkToro published research with Patrick O'Donnell of Gumshoe.ai asking whether AI tools return consistent brand lists. Their headline: there is a less than 1 in 100 chance that ChatGPT or Google's AI, asked 100 times, gives you the same list of brands in any two responses.
Two caveats worth stating plainly. One co-researcher works at an AI tracking vendor, a conflict SparkToro flagged itself. And SparkToro's starting position was skeptical of the whole category. Read it as a warning about single-run measurement, not as proof that tracking is pointless.
The practical consequence is simple. If one tool runs a prompt once a day and another runs it five times a week, they are sampling a noisy distribution at different rates. They will not match. Neither is broken.
Why six tools produce six numbers
Here are the main sources of divergence, roughly in order of how much they move the result.
1. Different prompt sets
This is the biggest one and the easiest to overlook. Each tool starts you with suggested prompts, or generates them from your site, or lets you type your own. Two tools tracking "best CRM for small business" and "top CRMs for startups" will report different visibility even if everything else is equal. A brand can look strong on commercial prompts and weak on informational ones.
2. Different collection methods
Some tools call model APIs. Others capture what the real consumer interface shows. These can differ: user-facing answers, citations and shopping results are not always the same as API output. Promptwatch, for example, says it collects data from the actual user interfaces of ChatGPT, Gemini, Perplexity, AI Overviews and others, and tracks API models separately to show what models believe from training data. I haven't verified how the other tools in this comparison collect, so check each vendor's documentation and ask support directly. It is the first question to put in writing.
3. Query fan-outs change under you
ChatGPT does not just run your prompt. It generates its own web searches. Promptwatch Data's ChatGPT query fanout report (page dated March 1, 2026) shows average searches per response around 2.15 in early December and about 1.84 by early March, and average fanout query length falling from about 117 characters to the high 80s. Fanouts then reappeared in April at exactly 1.0 per response after a gap in the data, with queries around 53 characters.
One oddity: the same page says a single prompt can trigger "3-8+" searches, which sits awkwardly beside a 1 to 2 average. I would not combine those numbers. The takeaway is narrower: retrieval behavior shifts in steps, so a prompt set tuned to last quarter's behavior can drift, and tools that refresh their prompts at different times will diverge.
4. Engines hand out different numbers of citation slots
Promptwatch Data's average sources per response report (dated September 23, 2025, so treat the exact figures as a snapshot) found:
- ChatGPT cites about 5 sources per answer, counting only responses where web search triggered.
- Google AI Overviews cites about 10, steadily.
- Perplexity cites almost exactly 10 every day, which the report calls a good test bench because movement reflects your content, not engine noise.
- Copilot swung from under 2 to nearly 17 within a few weeks, then settled low. Judge it on monthly trends.
So a tool that reports "citations" is not comparable across engines, and a blended score across engines will weigh them differently depending on the vendor's formula.
5. Different definitions of a mention
Does the tool count a brand named once in a long list the same as the top recommendation? Does it count one mention per response, or every occurrence? Does it understand aliases, or a brand name that is also a common word? Scores such as Visibility Score, Share of Voice, and Position each answer a different question. Promptwatch documents its definitions in its metrics overview, which is a decent template for what to ask every vendor.
6. Location, language and persona
A monitor pinned to the US in English will differ from one run in the UK, or one that stacks buyer personas. Tools handle location differently, and some fix it at monitor creation. If one tool is checking from a different country, you are comparing different markets.
7. Sampling frequency and timing
Daily runs, weekly runs, and hourly runs produce different averages from a noisy source. A tool that ran Tuesday morning and one that ran Friday night may see a different model version, too.
The common failure modes in comparisons
| Source of mismatch | What it looks like | How to neutralize it |
|---|---|---|
| Prompt set | Wildly different scores per tool | Import one identical prompt list everywhere |
| API vs real interface | Different cited sources for the same prompt | Document the method; compare within tool over time |
| Sample count | Scores that bounce day to day | Compare weekly or monthly averages |
| Citation counting | One engine looks "more visible" | Compare within an engine only |
| Mention definition | Share of Voice differs by 10+ points | Standardize aliases and counting rules |
| Location and language | Competitors rank differently | Match country, language, persona |
How to run your own 60-day, six-tool test
Sixty days is a sensible length. It is long enough to cover a few model updates and short enough that you will actually finish. Here is a design that holds up.
Step 1: Freeze the inputs
Build one spreadsheet of 40 to 60 prompts. Split them into branded, competitor comparison, and category (unbranded) prompts. Give each a country and language. Lock it. Do not edit prompts mid-test, even if a tool suggests better ones. If you add any, add them to every tool on the same day.
Step 2: Pick six tools that cover different approaches
Don't pick six near-identical trackers. Mix a full-stack platform, a lightweight monitor, and an SEO-suite add-on, so you can see whether method matters. A reasonable lineup from the directory:
Promptwatch is an end-to-end AI visibility platform: prompt tracking from real interfaces, citation and crawler data, and content tooling that acts on the gaps. Useful here because it can also show whether AI crawlers can even read your pages, which explains some visibility gaps no tracker alone can.
Profound is another full monitoring platform, positioned toward enterprise.
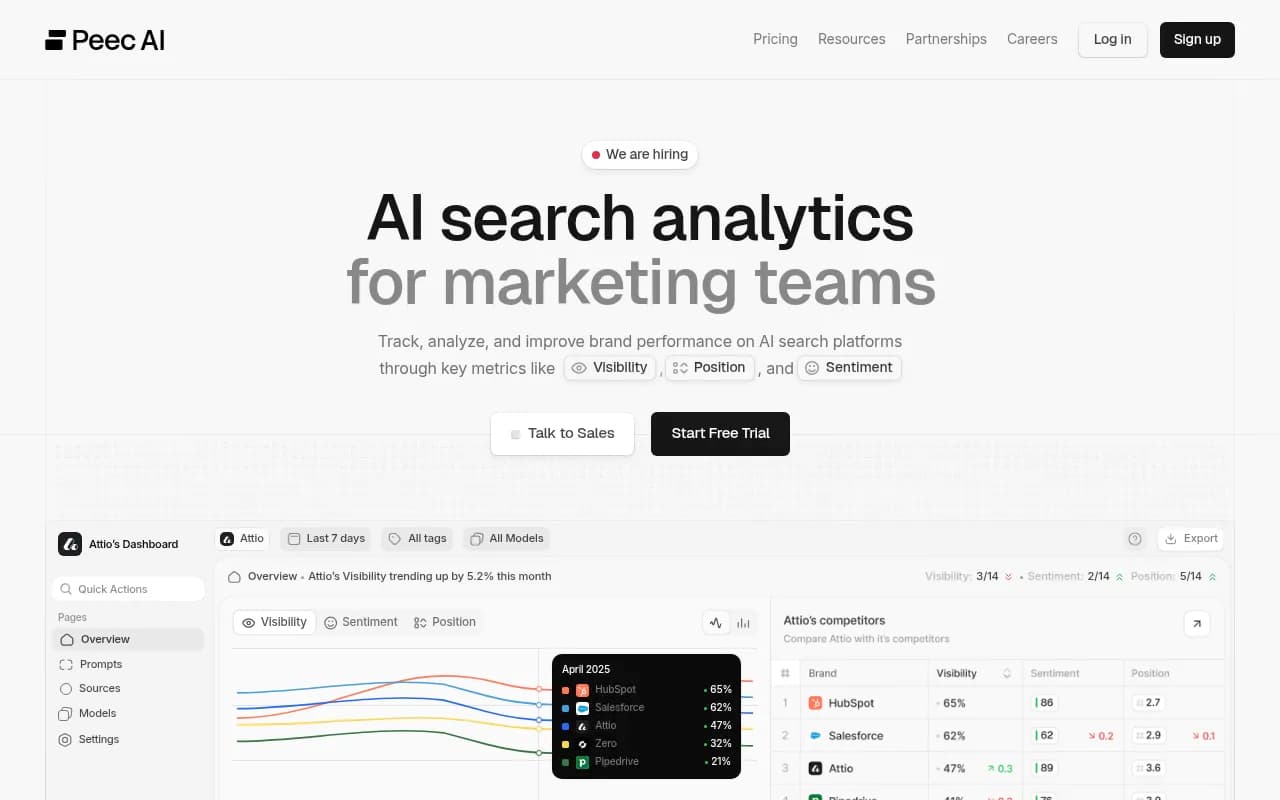
Peec AI is a lighter, multi-language tracker.
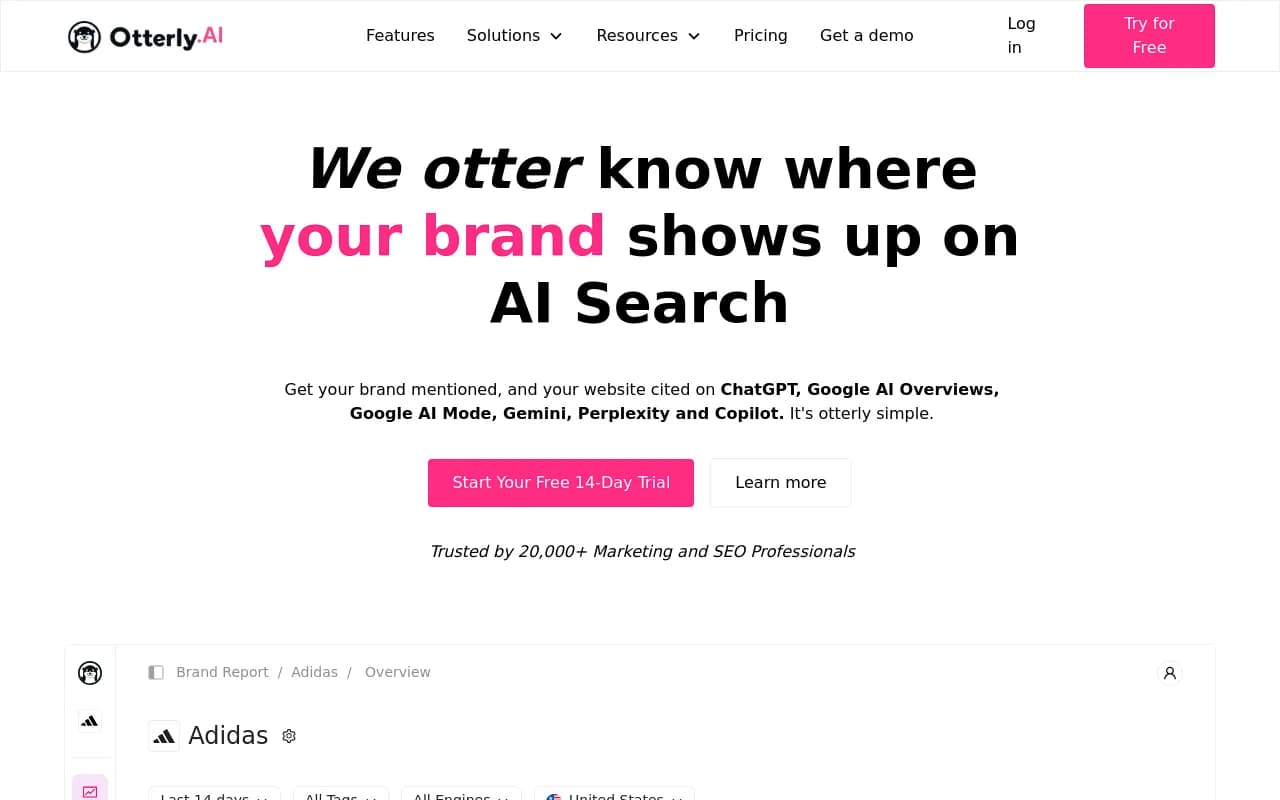
Otterly.AI is an affordable monitor, good for a baseline.
Scrunch tracks visibility across AI engines.
AthenaHQ monitors several AI search engines and adds optimization guidance.
If you would rather test an SEO suite's add-on, Semrush One or Ahrefs Brand Radar make a good contrast to the dedicated trackers, since they work from their own fixed prompt sets.
For more options by category, the GEO software directory at bestgeosoftware.com is a decent place to browse. Check plan limits first: some entry plans cap prompts or responses, which can quietly stop you loading the full list. Confirm current pricing on each vendor's site.
Step 3: Record the method, not just the score
For each tool, write down before day one:
- how it collects (API or real interface, as stated by the vendor)
- how often it runs each prompt
- how it defines a mention and a citation
- how it handles aliases and competitors
- whether location and language are configurable
If a vendor can't answer these, that is itself a finding.
Step 4: Add one ground-truth signal
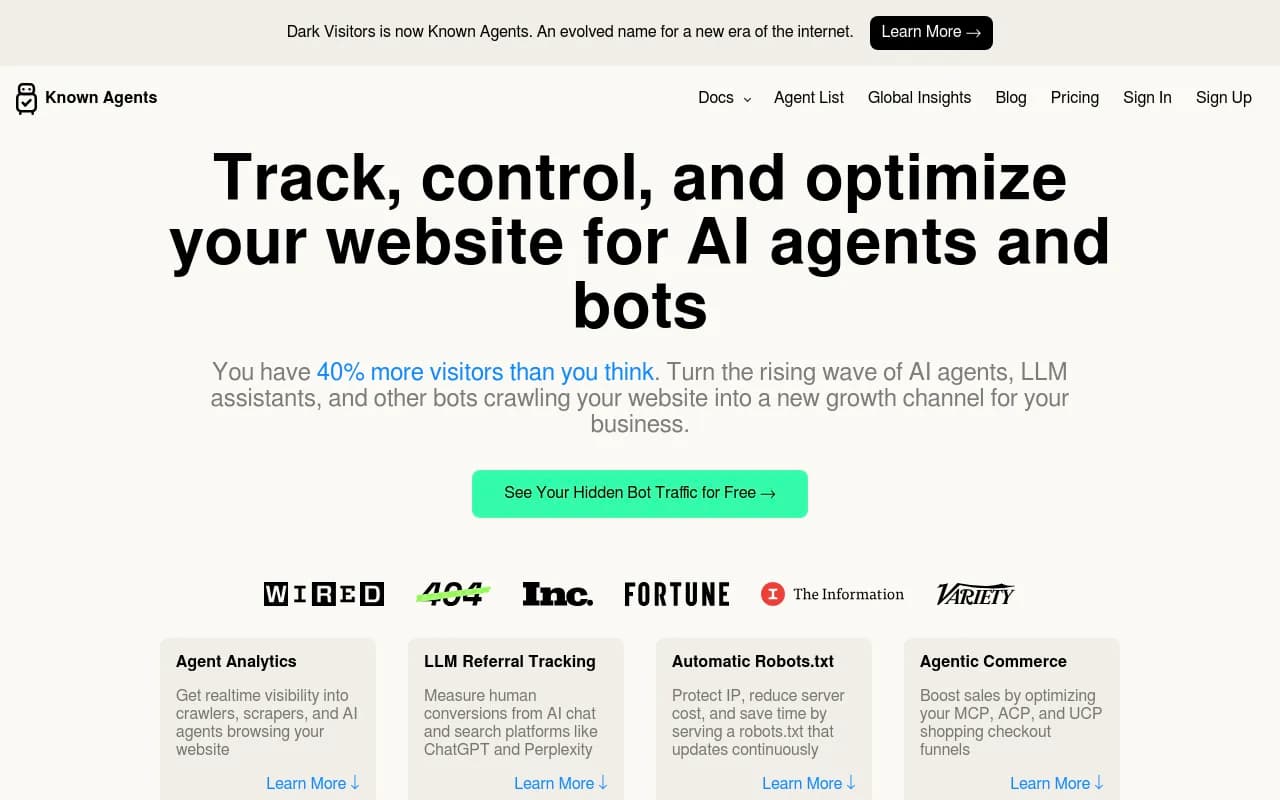
Trackers measure what AI says. You also want evidence of what happens on your site. AI crawler logs and AI-referred visits give you an anchor that does not depend on any tracker's sampling. Promptwatch has AI crawler logs and visitor analytics for this. DarkVisitors is a lighter option for bot tracking.
If a tool says visibility rose but crawler hits and AI referrals stayed flat, be skeptical.
Step 5: Compare at the right level
At day 60, do not ask which tool has the highest score. Ask these:
- Do all six agree on the direction of change (up, flat, down)?
- Do they agree on the rank order of you versus your top three competitors?
- Do they cite overlapping sources for the same prompts?
- Which tool's week-to-week variance is smallest on stable prompts?
- Which tool surfaced something the others missed, and was it real?
Direction and rank order are the metrics that should survive. If two tools disagree on direction after you have standardized inputs, that is the real discrepancy worth investigating.
Step 6: Use Perplexity as a control
Because Perplexity cites almost exactly 10 sources a day, per the Promptwatch Data report above, it is the calmest engine to test on. If tools still disagree on Perplexity with identical prompts, the cause is method or definitions, not engine noise. Then repeat the check on ChatGPT, where noise is higher and you need more samples.
What to expect from the results
Based on the mechanics above, here is what I would predict, flagged as prediction and not as findings:
- Absolute visibility scores will spread widely, possibly by tens of points.
- Competitor rank order will agree more often than absolute scores.
- Branded prompts will agree across tools much more than category prompts.
- Citation source lists will overlap only partially, more so on Perplexity and AI Overviews than on ChatGPT.
If your results look nothing like this, you have probably found a configuration mistake, which is also useful.
Reading the numbers in practice
- Use one tool as your system of record and keep it for at least a quarter. Switching tools resets your baseline.
- Treat any single-day swing as noise. Look at 7-day or 30-day averages.
- Never put two tools' scores on the same chart as if they shared a scale.
- Pair visibility data with traffic and conversion data. Promptwatch's guide to attributing AI traffic covers how, including the fact that ChatGPT stopped sending a referrer on October 8, 2026, which makes some AI traffic look direct unless you tag it.
- Ask vendors for raw responses. If you can read the actual answer behind a score, you can audit it.
Final take
The disagreement among tools is mostly a measurement-design problem, the same kind that makes Ads, Analytics and CRM disagree. The noise in AI answers is real and documented, but it is manageable with enough samples and identical inputs. Freeze the prompts, document each tool's method, anchor on crawler and traffic data, and judge tools by direction and rank order. After 60 days you will know which tool's numbers you trust, and why.