Key takeaways
- AI Overview coverage itself is volatile: Conductor's tracking shows the market swung from 23% coverage to 47% between September 2025 and January 2026, then corrected to 34% in February 2026. That's not noise, that's a structural reshuffle.
- Citation counts inside AI answers can drop overnight. After the GPT-5.3 rollout on March 4, 2026, average citations per ChatGPT response fell about 27% in a single day and never recovered, per Promptwatch Data.
- Volatility varies enormously by industry and by query type. Communication Services swung between 26.9% and 63.0% AIO coverage over six months; Real Estate barely moved, from 13.0% to 29.3%.
- Not all content decays at the same rate. Landing pages and docs stay cited for months; news articles lose half their citations within 36 days.
- Weekly rank checks aren't enough anymore. Daily tracking is the only way to tell whether a traffic drop is a platform-wide shift or something specific to your page.
The question nobody asked two years ago
Until recently, "how often does my ranking change" meant checking Semrush Sensor or Mozcast once a week and shrugging if nothing moved. Google's core updates happened a handful of times a year, and between them, things were mostly stable.
That assumption doesn't hold anymore. AI Overviews, AI Mode, and the citation layer inside ChatGPT, Perplexity, and Gemini move on a completely different clock. Some of it moves daily. Some of it moves in minutes, depending on who's searching and from where. If you're still checking your AI visibility monthly, you're working with data that was stale before you opened the spreadsheet.
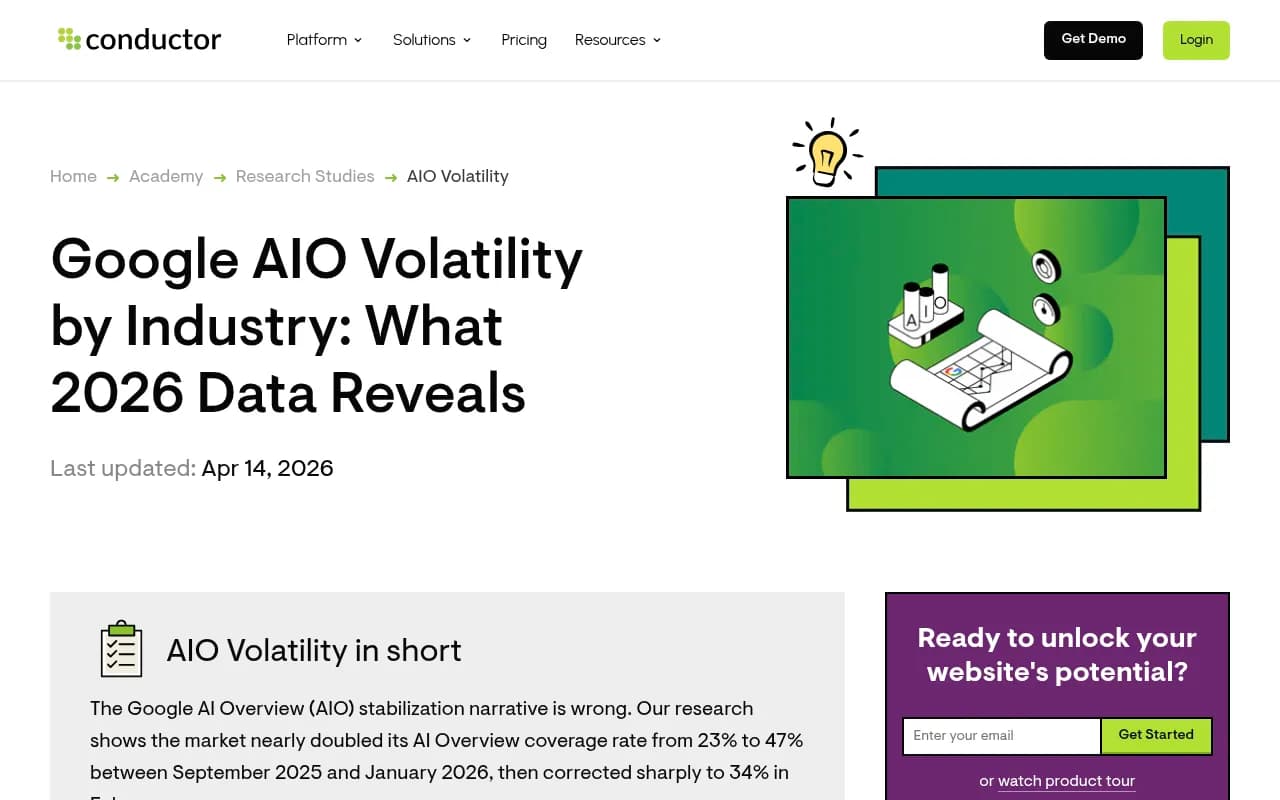
This isn't a theoretical concern. Conductor's research found that the market-wide AI Overview coverage rate nearly doubled, from 23% in September 2025 to 47% in January 2026, then dropped back to 34% in February. That's not a slow trend line. That's the kind of swing that would get a stock analyst fired if they called it "stable."
Two different kinds of volatility, and why conflating them is a mistake
Most people lump everything under "AI search volatility," but there are really two separate phenomena happening at once, and they need different tracking strategies.
Coverage volatility: does an AI Overview even show up?
This is the macro question. For a given keyword or query category, does Google decide to show an AI Overview at all? Conductor's volatility formula, ((current month % minus previous month %) divided by previous month %) times 100, captures this well. A 10% month-over-month change is a ripple. A 50% swing means the category essentially reshuffled.
The industry breakdown makes this concrete. Health Care sits at a high 42.8% average AIO trigger rate but has the lowest month-over-month volatility in Conductor's dataset, meaning it's predictably present. Energy, by contrast, swung 62.2% up in one month and 46.0% down the next. Same "high exposure" headline number, completely different level of trust you can put in it.
Citation volatility: who gets cited once an AIO appears
This is the micro question, and it's the one that actually determines whether your brand shows up. Even in a stable-coverage category, the sources Google or ChatGPT pulls into the answer can rotate daily.
Promptwatch's tracking of domain-rank tiers in ChatGPT citations found that the very top authority tier (DR 91-100) averaged roughly 7% of citations in the first week of August 2026, fell to about 5% by August 8, then dropped again to roughly 3% by August 14, a swing of more than 50% in two weeks. By the end of the month, those top-tier domains (4.4% average) were actually cited less often than the lowest-authority tier, DR 0-15 (6.3% average). That's a genuinely counterintuitive result: raw domain authority stopped being a reliable predictor of AI citation share, at least for that window. (https://promptwatch.com/data/chatgpt-citation-share-by-domain-rank-august-2026)
If you're only tracking coverage (did an AIO show up?) you'll miss this entirely. You need both layers.
What actually triggers a volatility spike
Model updates change citation behavior overnight
The clearest example from 2026: around the GPT-5.3 rollout on March 4, average citations per search-enabled ChatGPT response dropped by about 27%, from roughly 6.4 sources per response the week before to settling at 4.7-4.9 by late March. It happened within a day, across GPT-5.3, GPT-5.4, and GPT-5-Mini simultaneously, and showed no recovery a month later, according to Promptwatch Data. (https://promptwatch.com/data/chatgpt-citation-drop)
This is the key insight for anyone running an AI visibility audit: if your citation count drops 25%, the first question isn't "what did we do wrong," it's "did the platform just change how many sources it cites, period." A one-time snapshot can't answer that. Only continuous tracking can separate a platform-wide shift from an actual loss of visibility.
Crowded queries churn more than niche ones
Promptwatch's analysis of unique domains per ChatGPT response found that 47.6% of all responses cite 10 or more unique domains, and two-thirds cite at least eight. But this varies sharply by intent: organic, informational prompts cite 10+ domains in 52.5% of responses, while brand-specific prompts do so in only 21.3% of cases, with 40.7% of brand queries citing five domains or fewer. (https://promptwatch.com/data/chatgpt-unique-domains-per-response)
The practical read: if you're tracking generic, top-of-funnel informational keywords, expect daily reshuffling simply because so many domains compete for those slots. Branded queries are inherently more stable, not because Google or ChatGPT like you more, but because there's a smaller pool of sources to pull from.
Content format is shifting under everyone's feet
A slower, structural form of volatility is happening at the content-type level. In Google AI Overviews, listicles averaged about 18% of citations through most of July 2026 but lost the top spot to product pages on July 28, ending the month at 17.9% for product pages versus 16.2% for listicles. Video climbed to nearly 6% of citations, up from 2.7% in January. (https://promptwatch.com/data/ai-overviews-citation-types-over-time-july-2026)
ChatGPT shows a parallel pattern: product pages have nearly doubled their citation share since January, suggesting this isn't a Google-specific algorithm quirk but a market-wide pivot toward commercial, brand-owned pages. That's a trend you track over months, not days, but it still counts as volatility if your content strategy assumed listicles would stay dominant forever.
Even Google citing itself more is a form of competitive volatility
In June 2026, YouTube (4.16%), Reddit (2.72%), and google.com (2.30%) all hit 2026 highs in Google AI Overview citation share, together taking over 9% of all citations, roughly double their combined January share. Google's own citation share rose sixfold in five months, from 0.37% in January to 2.30% in June. (https://promptwatch.com/data/google-ai-overview-citation-share-june-2026) If Google is quietly carving out more space for its own properties, that's less room for everyone else, regardless of how good your content is.
How long does a citation actually last? Content half-life data
One of the more useful ways to think about volatility is half-life: once a page gets cited, how long before it's effectively gone?
Promptwatch tracked every page ChatGPT cited on a single day (July 6, 2026) for 90 days afterward, broken down by content type:
| Content type | Still cited at 30 days | Still cited at 60 days | Notes |
|---|---|---|---|
| Docs | 76% | 67% | Least volatile; 93% get re-cited at all |
| Landing pages | 78% | 69% | Very stable |
| Comparisons | 72% | 63% | Stable |
| Listicles | n/a | 60% | Moderate |
| Product pages, reviews, how-tos | n/a | 55% | Half-life around day 74-77 |
| News | n/a | 41% | Most volatile; 25% never cited again after day 0 |
(Source: https://promptwatch.com/data/chatgpt-content-half-life)
The takeaway is blunt: if your AI visibility strategy leans on news-style content, you're signing up for constant republishing just to stay visible. Docs, comparisons, and landing pages are a much better long-term bet if you want citations that don't evaporate in five weeks.
Comparing volatility to traditional SERP tracking
It helps to put AI volatility next to the kind of ranking volatility SEOs are already used to watching. Semrush Sensor, Mozcast, and similar trackers spiked during the March 2026 Google core update, with Semrush Sensor hitting 9.5 out of 10. A later spike on August 12-13, 2026 only reached 5.3, about 56% of the March peak. July 2026 saw back-to-back spikes of 10.38 and 9.83.
Those are classic, infrequent, event-driven spikes. AI Overview and AI citation volatility is different: it's closer to continuous low-grade churn punctuated by occasional sharp drops tied to model updates, not algorithm updates in the traditional sense. You can't apply the same "check weekly, investigate spikes" mental model to both.
Worth noting too: Google AI Overviews can legitimately show different results to different users for the identical query, based on device, location, search history, and A/B test cohort. Some of what looks like volatility in your tracking tool is actually personalization, not an algorithm shift. This is exactly why single-query, single-location checks are misleading, and why tools that sample across many locations and personas produce more trustworthy volatility signals.
What to track daily versus weekly
| Metric | Frequency | Why |
|---|---|---|
| AIO/citation trigger rate per keyword | Daily | Tells you if the game board changed for that query |
| Which domains are cited | Daily | Citation-slot volatility can flip in under 24 hours |
| Average sources per response | Weekly | Platform-level shifts, like GPT-5.3's citation drop, need a few data points to confirm |
| Content-type mix of citations | Monthly | Structural shift, moves slowly but matters for content planning |
| Industry-level coverage % | Monthly | Conductor-style benchmarking against your sector |
Tools for tracking this without losing your mind
Manually checking dozens of keywords across multiple AI platforms every day isn't realistic. This is exactly the gap dedicated AI visibility tools exist to fill, though they differ a lot in depth.
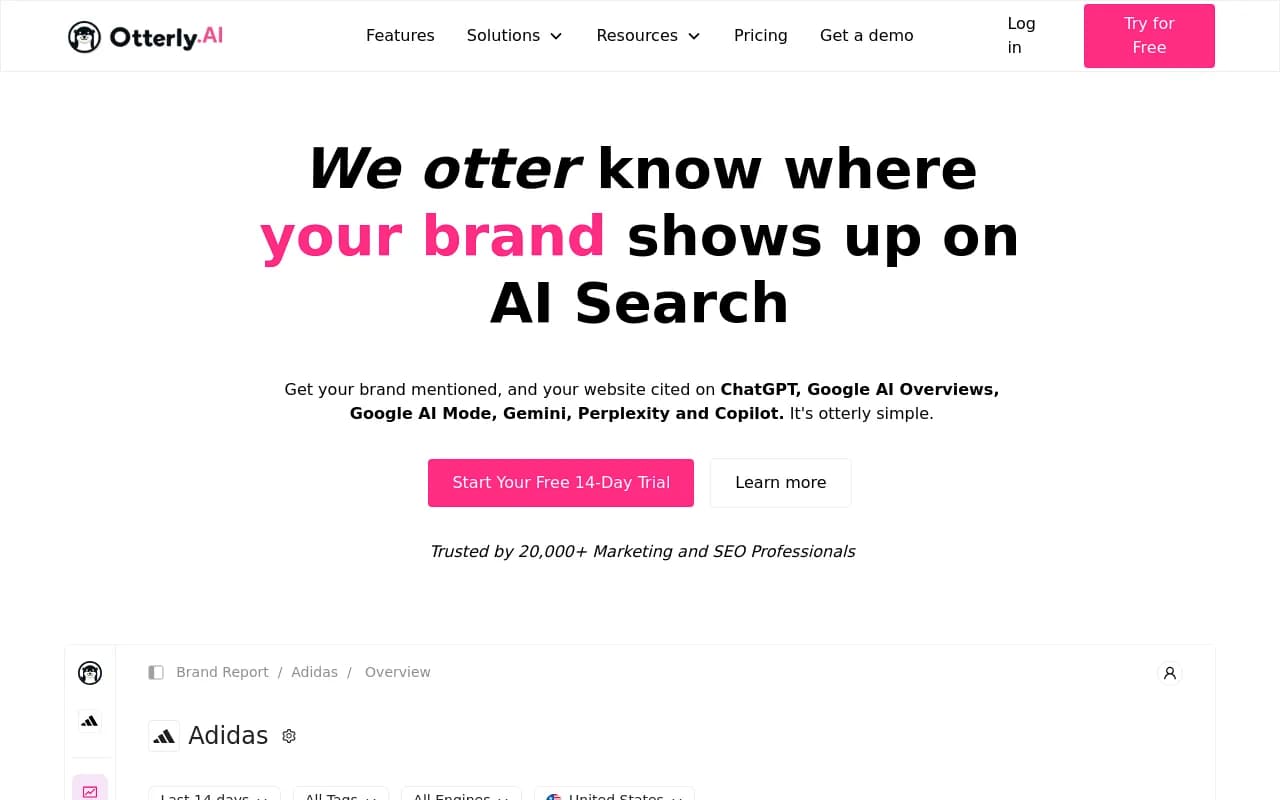
Otterly.AI is a reasonable entry point for teams that want daily tracking across ChatGPT, Google AI Overviews, Perplexity, and Microsoft Copilot without a huge budget, starting around $29/month for a lite plan with 15 prompts.
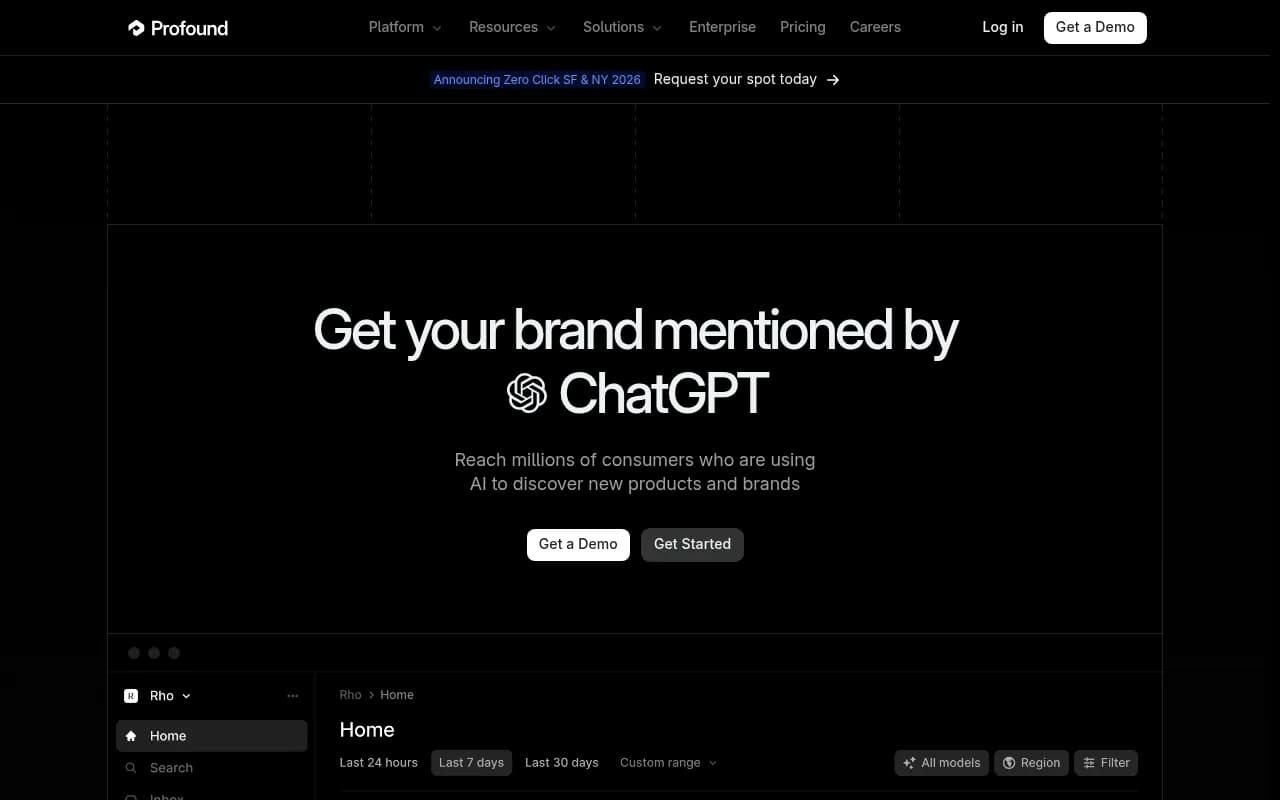
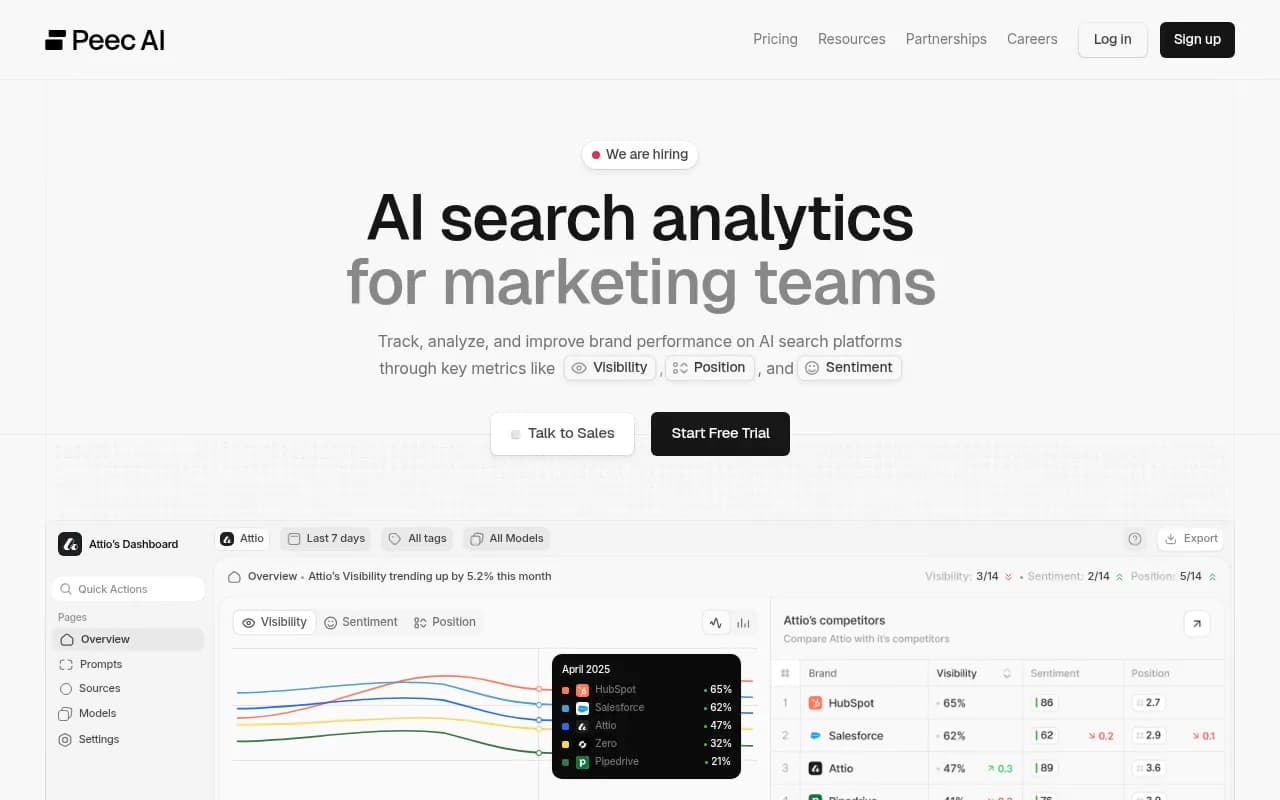
Profound and Peec AI both offer daily-cadence tracking across multiple engines, with Peec AI letting you pick which engines to track per plan and Profound leaning toward enterprise content optimization features at higher tiers.
SE Ranking and Keyword.com both bundle AI Overview tracking into broader SEO platforms if you'd rather not run a separate tool.
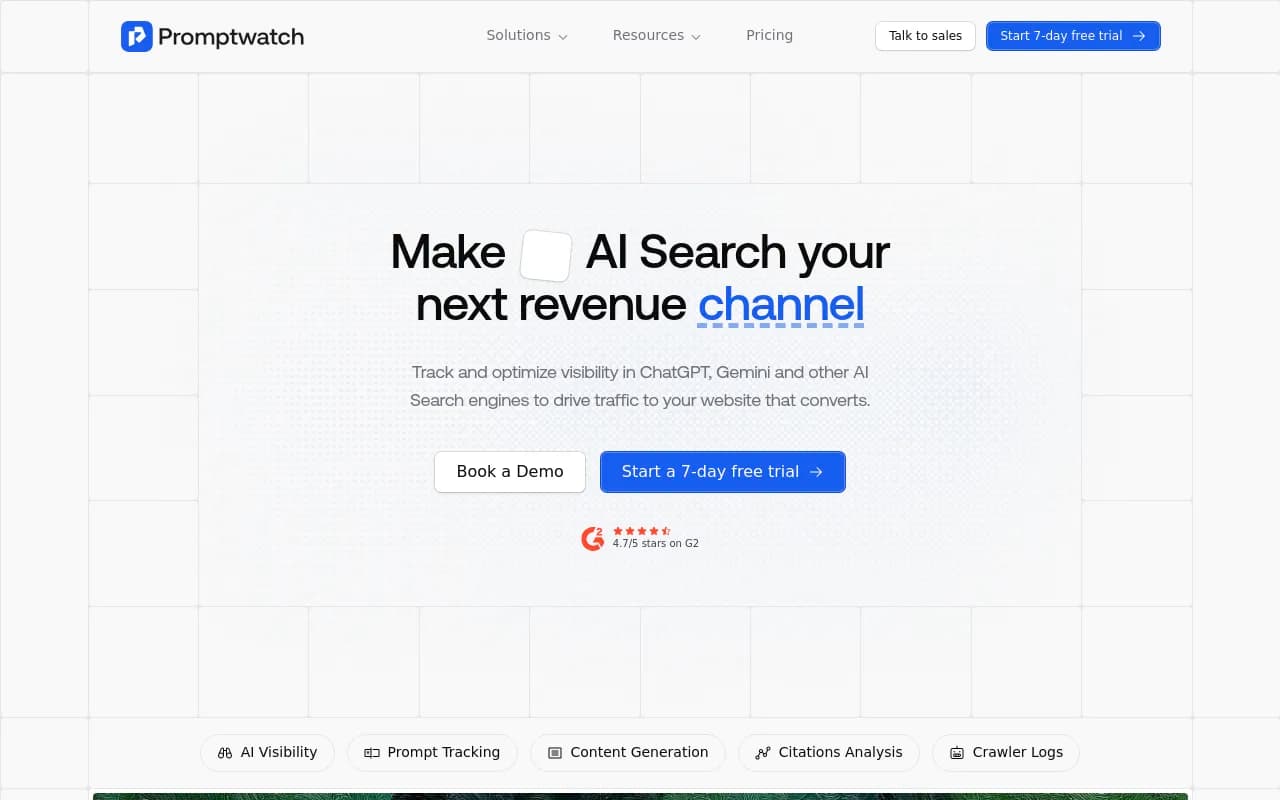
Where most of these tools stop short is turning volatility data into something you actually act on. A tracker that tells you "your citation share dropped 12% this week" is useful. A platform that also shows you why (via crawler logs), where AI is finding your competitors instead, and then drafts and publishes the content fix, is a different category of tool. That's the gap Promptwatch is built to close. It tracks daily citation and prompt data across ChatGPT, Gemini, Claude, Perplexity, Grok, and Google AI Overviews and AI Mode, pairs it with AI crawler logs showing exactly when bots read your pages, and runs Content Agents that generate and publish GEO-optimized updates to fix the gaps it finds, rather than leaving you to interpret a dashboard alone.
Comparison at a glance
| Tool | Tracking frequency | Engines covered | Goes beyond monitoring? | Starting price |
|---|---|---|---|---|
| Otterly.AI | Daily | ChatGPT, AI Overviews, Perplexity, Copilot (others paid add-on) | No | $29/mo |
| Profound | Daily | ChatGPT only on entry tier, up to 10+ on enterprise | Limited content tools on higher tiers | $99/mo |
| Peec AI | Daily | Choose 3 of 6 engines on entry tier | No | ~$95/mo |
| Promptwatch | Daily, with crawler logs | ChatGPT, Gemini, Claude, Perplexity, Grok, AI Overviews, AI Mode, and more | Yes, Content Agents, Unified Actions, Agent Chat | $95/mo |
What this means for how you should actually work
A single snapshot of your AI visibility tells you almost nothing useful. Was that citation drop because a competitor outranked you, because Google changed how it picks sources for your industry, or because ChatGPT rolled out a new model that cites fewer sources across the board? You cannot answer that question without a trend line.
The practical move is to separate your tracking into the two layers this data points to: watch coverage rate (does an AIO or citation even trigger) on a monthly cadence for strategic planning, and watch citation composition (who's actually cited, and is it you) daily, because that's where the real churn lives. If you want a broader sense of which platforms handle this well, the GEO software directory at bestgeosoftware.com is a reasonable place to compare options side by side.
One more thing worth internalizing: stability isn't the same as safety. Health Care's AIO coverage is both high and predictable. Energy's coverage swings wildly in both directions. Neither situation means "don't bother." It means your reporting cadence and your panic threshold should be calibrated to your specific industry's volatility profile, not some generic SEO rule of thumb written before any of this existed.