Key takeaways
- Google AI Mode and AI Overviews are two different surfaces with different citation behavior. Reporting them as one blended "AI visibility" number hides more than it reveals.
- A credible AI Mode report needs a fixed prompt set split by branded, category, comparison, and consideration queries, run weekly for the team and rolled up monthly for clients or leadership.
- Google Search Console's generative AI performance report gives impressions by page, but no clicks or queries, so you still need a dedicated AI Mode tracking tool to see which prompts you're winning or losing.
- Citations, not just mention rate, are the actionable part of the report. List the domains AI Mode pulled from, including Google's own properties, which punch well above their weight in AI Mode specifically.
- Tie every visibility number to a business outcome, traffic, branded search lift, or pipeline, or the report reads as an activity log instead of proof of work.
Why AI mode needs its own report, not a slide in your SEO deck
I've sat through enough client calls where someone pulls up a single ChatGPT screenshot and says "see, we're not showing up." That's not a report, it's an anecdote. And when the topic is Google AI Mode specifically, the problem gets worse, because AI Mode doesn't behave like AI Overviews, and it definitely doesn't behave like a normal SERP.
A 30,000-citation study from Otterly.ai comparing the two surfaces on German queries found AI Mode triggered on 100 out of 100 top queries tested, while AI Overviews appeared on only 49. When both did trigger, AI Mode cited an average of 310 sources per query against 51 for AI Overviews, a sixfold gap. AI Mode also pulled from 3,621 unique domains across the study compared to 615 for AI Overviews, yet AI Overviews' citations were more concentrated at the top (21.8% of citations went to the top 10 domains, versus 18.8% in AI Mode).
That's not a rounding difference. That's two different systems rewarding two different kinds of content. If your report averages them into one "AI visibility score," you're telling a client their brand improved when really AI Mode surged and AI Overviews slipped, or the other way around, and nobody can act on an average.
There's a second reason to separate them: Google favors its own stuff more in AI Mode. Promptwatch's June 2026 citation data shows google.com itself captured 7.31% of all Google AI Mode citations that month, more than YouTube (2.88%) and Reddit (2.52%) combined, and that share climbed from 4.24% in May, a 72% jump in a single month. Add YouTube and Google-owned properties clear 10% of the AI Mode citation mix. In Google AI Overviews, by contrast, Google-owned domains sit closer to 3.6% per the Otterly.ai data. If you're presenting to a client who doesn't manage their Google Business Profile well, that's a finding worth a slide of its own, not a footnote.
The seven sections every AI mode report should have
I've adapted this from frameworks used by Yozigo and Notified, two teams that build AI visibility reports for a living, and tightened it for AI Mode specifically.
1. Executive summary
One paragraph. Visibility this period versus last, the single best result, the single biggest gap, and one recommended action. Leadership reads this and nothing else most months, so don't bury the ask.
2. AI Mode visibility, reported separately from AI Overviews
Share of tracked prompts where the brand was named or cited in AI Mode specifically, split into branded and unbranded (category) prompts. Do not blend this with AI Overviews data in the same percentage. Put them in adjacent rows of the same table so a reader can compare the two surfaces without you doing the comparison for them.
| Surface | Branded prompt mention rate | Unbranded prompt mention rate | Avg. citations per triggered answer |
|---|---|---|---|
| Google AI Mode | e.g. 68% | e.g. 9% | ~310 (varies by query) |
| Google AI Overviews | e.g. 74% | e.g. 11% | ~51 |
| ChatGPT | e.g. 61% | e.g. 6% | ~5 |
Fill these with your own tracked numbers each period. The structural point, branded prompts inflate visibility and mask weak category-level presence, is backed by Yozigo's analysis of 232,838 answers: brands were named in 77 to 97% of branded-question answers but only 2.4 to 4.8% of category questions. A blended score across branded and unbranded hides exactly the gap your client is paying you to close.
3. Position, prominence, and sentiment
Where in the AI Mode answer does the brand show up, first paragraph, a secondary citation, buried in a "other options" list? And how is it described, positively, neutrally, or with a complaint attached? This is the part that turns a yes/no mention into something a brand manager can actually react to.
4. Share of voice against named competitors
Pick two or three competitors that matter to this client and report mention share on the same prompt set. Be explicit about your denominator here. GrowByData's worked example shows the same underlying data can read as 20% mention share (brand mentions divided by total mentions across brand and competitors) or 6% citation share (citations to the brand's own domain divided by total citations). Those are both legitimate numbers, they just answer different questions. State which one you're using at the top of the section, every time.
5. Sources cited, with the Google-owned properties called out
List the top domains AI Mode pulled from for this client's prompt set. Flag anywhere Google's own properties, Maps, Business Profile, Merchant Center, YouTube, Search appear in that list, since Promptwatch's data shows these can account for over 10% of the AI Mode citation mix on their own. If a client's AI Mode visibility is weak and their Google Business Profile hasn't been touched in a year, that's your action item right there.
6. Questions won and lost
Which prompts gained a mention this period, which lost one, and what source changed. This is the section that makes the report feel like ongoing work rather than a monthly snapshot of the weather.
7. Actions taken and results tied to them
What you shipped this period, and which prompts or pages it was meant to move. This closes the loop between the work and the number, which is the single thing that separates a report clients renew against from one they stop opening by month three.
Metrics glossary worth including as an appendix
Clients and leadership ask the same three questions every quarter: what does this metric mean, how is it calculated, and why did it move. Save yourself the repeat explanation by including a one-page glossary.
- AI Mode mention rate: percentage of tracked prompts where the brand appears anywhere in the AI Mode answer.
- Citation share: percentage of total citations across the prompt set that point to the brand's own domain, distinct from mention share.
- Prompt confidence: Yozigo's rule of thumb is to mark anything under 5 responses per question as low-confidence, since AI answers vary between sessions and even between users on the same query.
- Sources per response: Perplexity holds steady at roughly 10 sources per answer, making it the most predictable engine to benchmark against. Microsoft Copilot swings between under 2 and nearly 17 sources per response within weeks, so judge it on a monthly trend line, never a single week.
Common mistakes that wreck the report's credibility
I've made some of these myself early on, so this list comes from experience as much as research.
- Blending branded and unbranded prompts into one score. It inflates the headline number and hides weak category visibility, exactly the problem a client hired you to fix.
- Changing the prompt set between reports without flagging it. A new prompt list moves the score even when nothing real changed on the client's site. If you must update the set, show both the old and new numbers side by side for one transition period.
- Reporting a single answer instead of an average. AI answers vary between sessions, even for the same query from the same account. One screenshot is an anecdote, not data.
- Leaving out the actual cited sources. A report that says "visibility improved" without showing which pages got cited gives the client nothing to act on next month.
- Skipping the business link. Visibility numbers that never connect to traffic or pipeline read as an activity log. One data point worth citing here: Seer Interactive found ChatGPT referral traffic converted at 15.9% against 1.76% for Google organic in their analysis, the kind of downstream number that makes a visibility report land with a CFO.
Data sources to pull from
Google Search Console's Search Generative AI performance report, rolled out in June 2026, shows AI Mode and AI Overviews impressions broken down by page, country, device, and date. It's useful as a baseline but it carries no click, click-through rate, or query data, a gap flagged by Search Engine Land when the reports launched. You can cross-reference pages with high AI impressions against your regular Search performance data to spot content that's earning clicks beyond the AI answer, usually a sign of original research or first-hand detail the summary can't replace.

Bing Webmaster Tools added its own AI Performance report in public preview in February 2026, including a Citation Share metric, if the client cares about Copilot too.
For the actual AI Mode prompt tracking, you'll want a dedicated tool rather than stitching screenshots together by hand.
For brands and agencies that want AI visibility reporting folded into a broader GEO workflow, tools like Promptwatch track AI Mode alongside ChatGPT, Perplexity, Gemini, Claude, and Grok, with citation trends, crawler logs, and a content gap analysis layer that goes beyond just tracking whether you were mentioned.
Tool pricing snapshot for your appendix
If leadership asks what the tracking actually costs, have this ready. Pricing moves often, so treat these as a starting point rather than gospel.
| Tool | Entry price | AI Mode included at entry tier? | Notes |
|---|---|---|---|
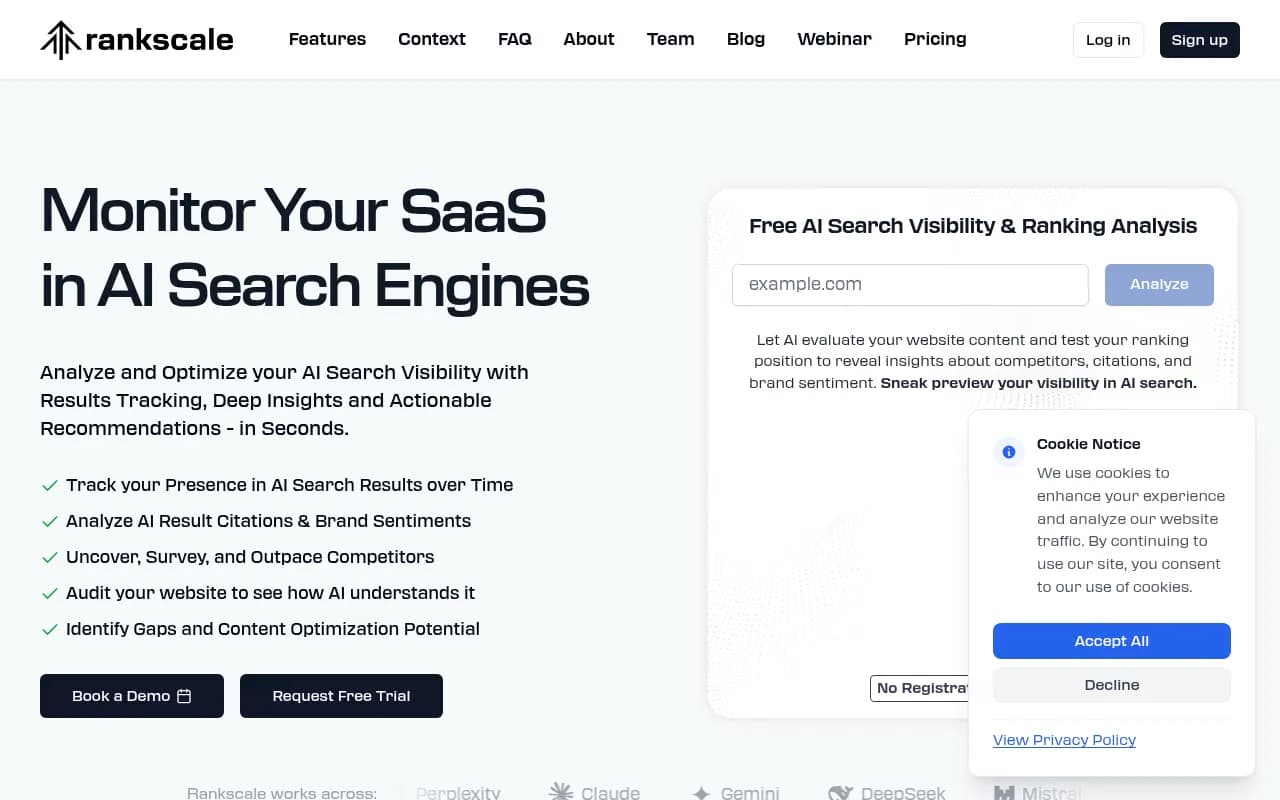
| Rankscale | ~$20/mo (credit-based) | Yes | Covers 17+ engines |
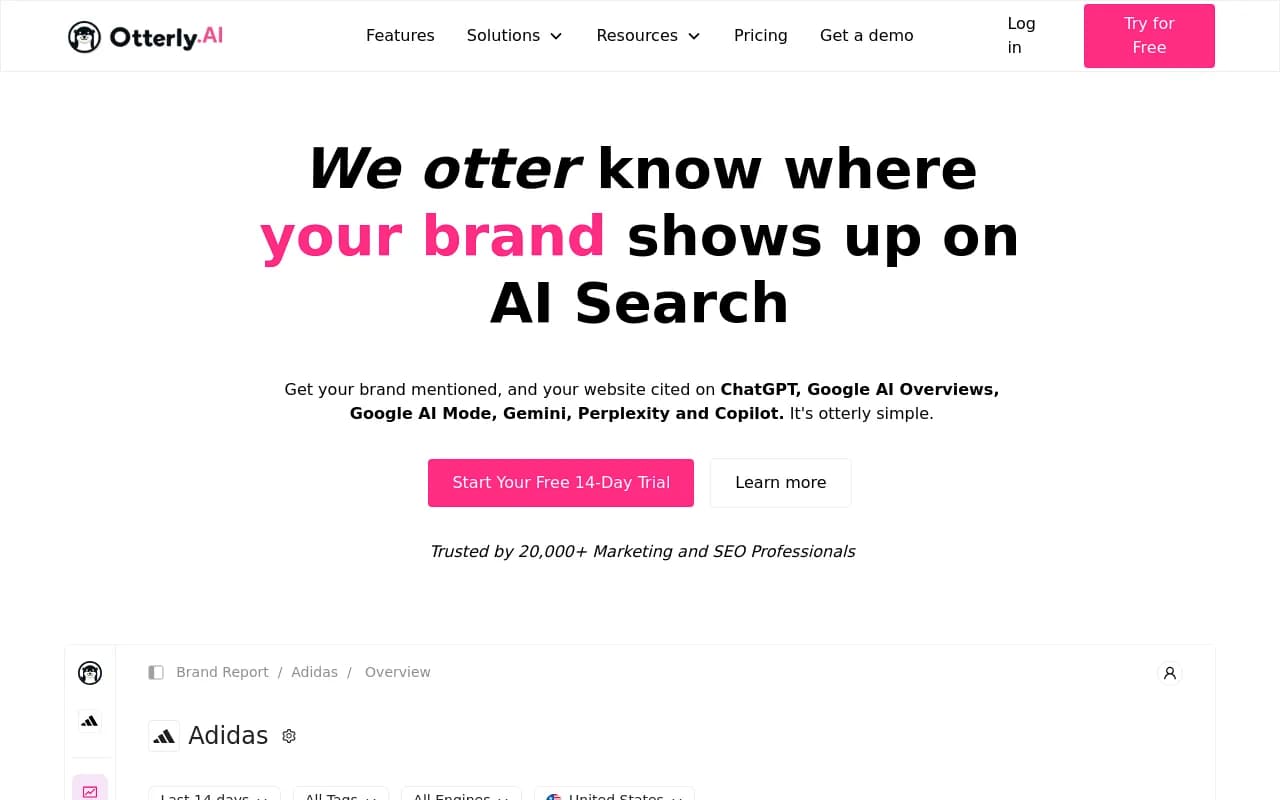
| Otterly.ai | $29/mo (15 prompts) | No, $9/mo add-on | Scales to $489/mo at 400 prompts |
| Nightwatch | ~$79/mo | Yes | Daily refresh, 50 prompts |
| Peec AI | ~€85-89/mo | Yes | No built-in action layer |
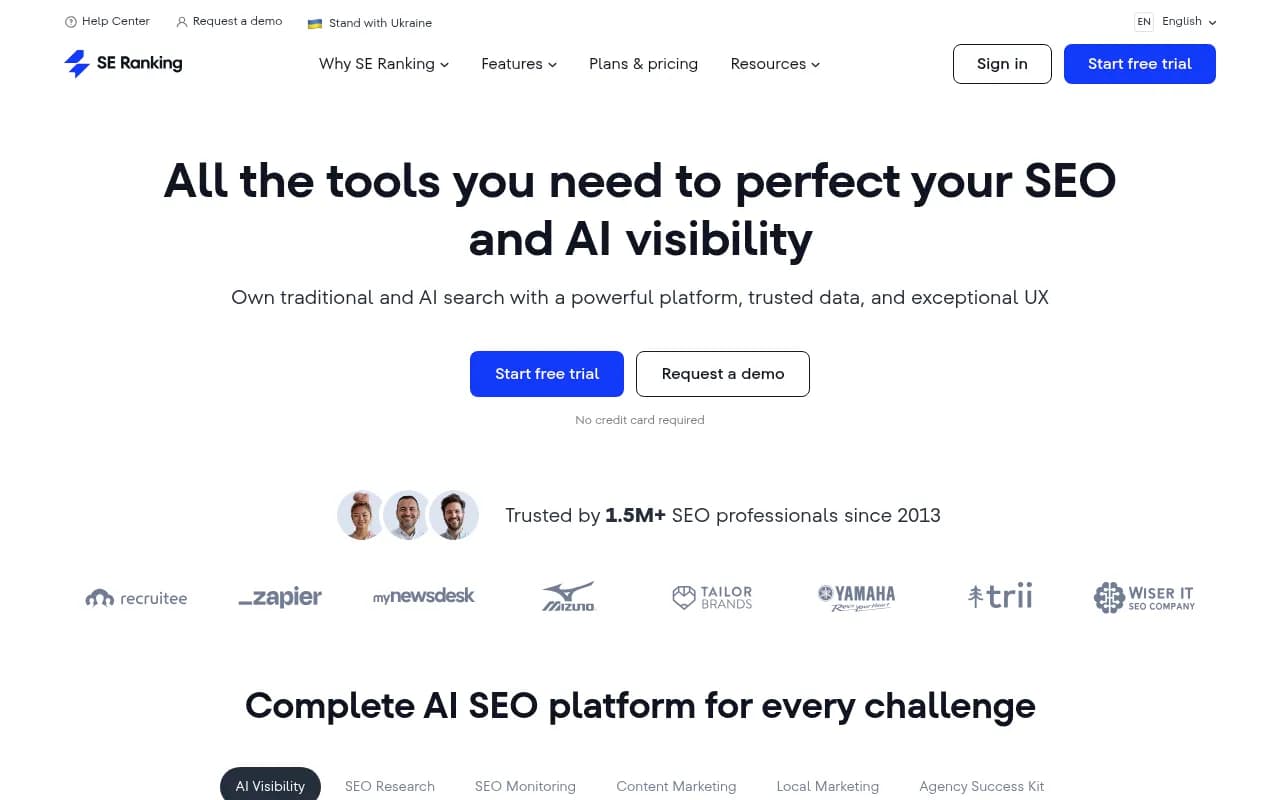
| SE Ranking | $129/mo (core) | No, $89-345/mo add-on | AI Mode gated behind add-on |
| Ahrefs Brand Radar | ~$129/mo | No, higher tier | Bundled with backlink data |
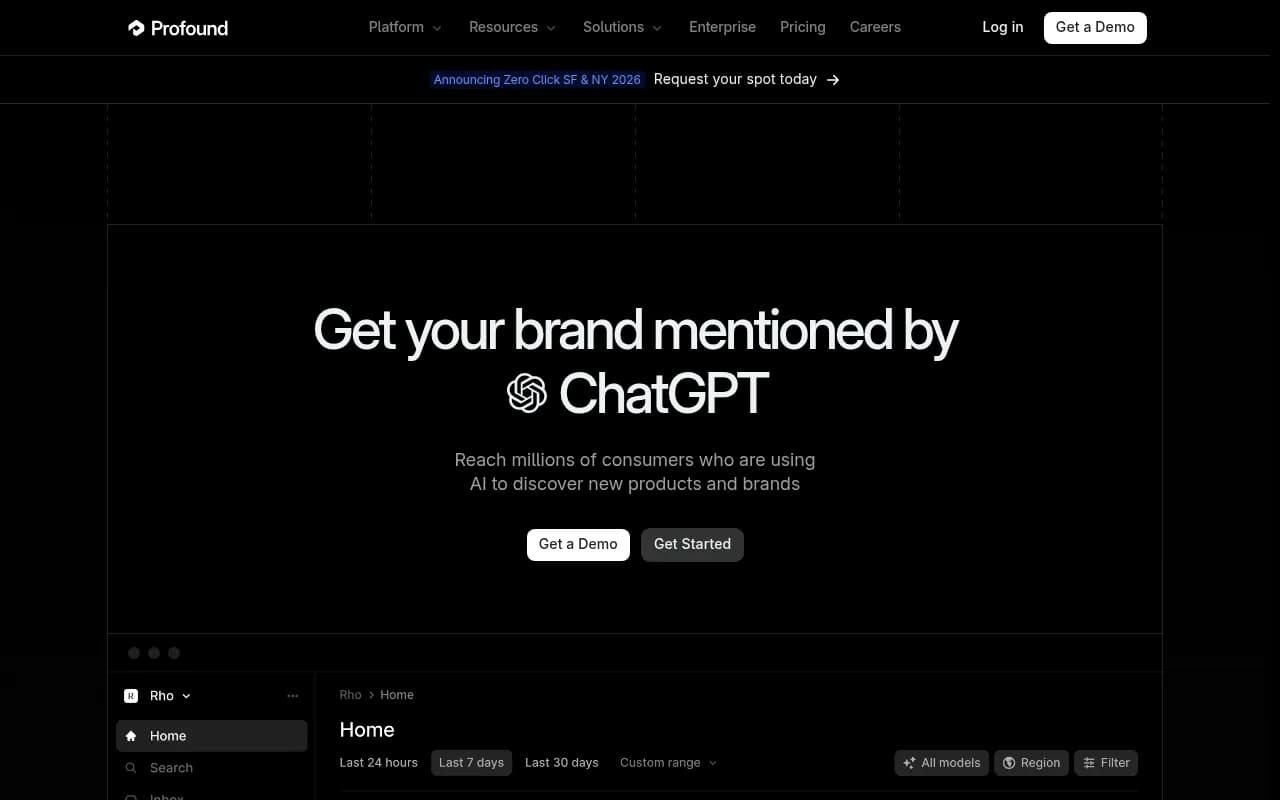
| Profound | Mid-market pricing | No, needs $399/mo tier | Enterprise focus |
| Scrunch AI | $100/mo | Yes | No action layer |
The pattern across most vendors: a low headline price, then AI Mode gated behind an add-on or a higher plan. Ask directly whether the price you're quoted actually includes AI Mode, or you'll find out at renewal.
Cadence: who gets what, and how often
Weekly reporting for the working team catches a lost mention while it's still cheap to fix. Monthly reporting for leadership and clients shows whether the trend is actually moving, since week-to-week AI answers are noisy by nature. Send leadership the summary page, not the full appendix, and keep the appendix available for the one client in ten who wants to see the raw tables.
If you're building reports across multiple clients or want to see how other GEO and AI visibility platforms structure their dashboards, the directory at bestgeosoftware.com is a reasonable place to compare options side by side before committing to one tool's report format for the next year of client meetings.