Key takeaways
- Build one view per AI engine. ChatGPT cites about 5 sources per web-search answer, while AI Overviews and Perplexity cite about 10, so a blended score hides the real picture.
- A heatmap is the fastest way to see where you are invisible: brands, topics, models, countries, or personas on the axes, colored by Visibility, Sentiment, Position, or Share of Voice.
- Use a 30-day window for share metrics and annotate engine-side changes, because short windows distort month-over-month deltas.
- Start with six templates: executive summary, competitor comparison, topic gaps, citation sources, AI traffic, and crawler health.
- Most dashboards fail because they report and stop. Pair each panel with an action owner.
Why most AI visibility dashboards get ignored
I have seen plenty of marketing dashboards with twenty charts and zero decisions attached. AI visibility dashboards are heading the same way. The problem is rarely that you lack charts. It is that nobody can tell from the chart what to do on Monday.
A good dashboard in 2026 does three jobs: it collects data automatically, shows patterns across engines and topics, and points to the next action. That framing matches what Trackingplan argues in its guide to AI marketing dashboards, where the dashboard should move beyond passive reporting if the upstream data is connected and normalized.
This guide gives you templates you can copy, the metrics that belong on each, and a worked heatmap built from real citation data.
The metrics worth putting on a dashboard
Before choosing layouts, agree on a small metric set. Too many teams track mentions only. These are the ones that locate a problem:
| Metric | What it tells you | If it is weak |
|---|---|---|
| Visibility Score (0-100) | Placement, share of attention, and depth in each response | Coverage or prominence problem |
| Share of Voice | Your slice of all brand mentions | Competitors dominate the answer set |
| Position | Where you land in the brand order (lower is better) | You are mentioned late |
| Sentiment (0-100, ~50 neutral) | Tone of what AI says | Reputation problem |
| Citation share and rank | How often and how high your domain is a source | Content or crawlability problem |
| Self-citation rate | Share of citations pointing at your own domain | AI learns about you from third parties |
Read them together. Low Share of Voice with decent sentiment usually means you are not in enough answers. Mentions without self-citations point to content or crawl access. The definitions are laid out in the metrics overview if you want a shared vocabulary for your team.
Design rules that save you from bad conclusions
These come straight from how AI answers behave, using Promptwatch Data as the evidence.
Separate the engines
Citation inventories differ. According to Promptwatch's average sources per response report (published September 2025, so treat the exact figures as dated), ChatGPT cites about 5 sources per web-search answer, Google AI Overviews about 10, and Perplexity almost exactly 10 every day. A single blended score treats a five-slot engine and a ten-slot engine as the same thing. Give each engine its own tab or filter.
Use a 30-day window for share metrics
Seven days is noisy. Promptwatch's own social citation reports show why: the October report covered a 7-day window (Sep 28 to Oct 4) and the November report covers 30 days (Oct 11 to Nov 9). Comparing them is not like-for-like, and any month-over-month delta between them should carry a footnote. Do the same on your dashboards: fix the window, and label it.
Annotate engine-side changes
Some swings are not your doing. Microsoft Copilot's citations per response moved from under 2 to nearly 17 within a few weeks, then settled low. ChatGPT's reddit.com share fell from about 4% to 0.5% on August 14, 2026, per Promptwatch's Reddit citation data. Add an annotation layer so a drop in your numbers can be checked against a known engine change before anyone panics.
Pick a stable baseline
Perplexity is steady at about 10 citations a day, which makes it a decent test bench. If your pickup there changes, it is more likely your content than engine noise.
Template 1: the executive summary
One screen, built for a CMO who gives it ninety seconds.
- Visibility Score trend, 30 days, with an A/B comparison against the prior period
- Share of Voice against your top three competitors
- AI-referred sessions and conversions
- Three actions in progress, with owners
Keep it free of per-prompt detail. If the number moves, a link should take the reader to the engine view that explains it.
Template 2: competitor comparison
Rows are brands, columns are engines, cells are Share of Voice or Visibility. This is the layout agencies use most, and the Cairrot team describes the heatmap approach in its AEO reporting guide: visibility intensity across prompt topics over time, so clients see a visual that maps to their content strategy.
Add a Position column next to Share of Voice. A brand can win on mentions and still sit fourth in every answer.
Template 3: topic gaps
Rows are topics, columns are your brand and each competitor. Color by Citation Share. The cells that are cold for you and hot for a competitor become your content roadmap. Pair it with a list of the prompts inside each cold topic, plus the pages AI already cites for them.
Template 4: citation sources
This one answers where AI gets its information about you. Panels:
- Top cited domains and URLs
- Source type mix (directories, forums, news, your own site)
- Reddit, YouTube, and LinkedIn citations
- Self-citation rate over time
Content type matters here too. Promptwatch's content type report found product pages were 22.4% of ChatGPT citations from Sep 28 to Oct 4, 2026, ahead of landing pages and listicles. If your cited pages are all blog posts, that is worth a look.
Template 5: AI traffic and conversions
Visibility is a means. Put sessions, conversions, and top landing pages from ChatGPT, Perplexity, Gemini, Claude, and Copilot on their own dashboard. One wrinkle: ChatGPT stopped sending a referrer on October 8, 2026, so tag links with utm_source=chatgpt.com and count that as ChatGPT traffic, or your numbers will quietly sag. The attribution guide covers the setup.
Template 6: crawler health
If AI bots cannot read a page, no amount of content work helps. Chart crawler requests by bot, errors by page, and the crawl-to-citation path. This view separates an access problem from a content problem, which is the argument most teams have too late. See the AI crawler logs feature for what verified logs look like, and Promptwatch's crawler traffic data for industry benchmarks.
Worked heatmap: social platforms by AI engine
Here is a heatmap you can build today. Rows are social platforms, columns are engines, and values are the share of each engine's citations. The data is from Promptwatch's November 2026 social media citations report, covering Oct 11 to Nov 9, 2026.
| Platform | Google AI Overviews | Perplexity | ChatGPT |
|---|---|---|---|
| YouTube | 6.71% | 0.31% | 0.03% |
| 2.34% | 0.09% | 0.01% | |
| 2.10% | 0.82% | 0.40% | |
| 1.02% | 0.02% | ~0.00% | |
| 0.78% | 0.66% | 0.20% | |
| TikTok | 0.19% | n/a | n/a |
| X | 0.02% | 0.04% | ~0.00% |
| Total social | 13.16% | 1.94% | 0.64% |
A few things jump out. YouTube alone (6.71%) beats the other six platforms combined (6.45%) in AI Overviews. Reddit is back as ChatGPT's top social platform at 0.40%, up from 0.09% in the October report, though remember the window difference. And X is effectively zero everywhere.
The color scale matters. Nearly every cell sits below 1%, so a linear scale from 0 to 100 gives you a blank grid. Set the scale to run from 0.00% to roughly 7% so the small values still show contrast.
The takeaway Promptwatch draws: put YouTube first for Google audiences, focus on Reddit and LinkedIn for Perplexity, do not lean on social posts for ChatGPT, and keep X out of AI search plans.
Other heatmap layouts to try
| Layout | Rows | Columns | Color by |
|---|---|---|---|
| Competitive | Brands | Engines | Share of Voice |
| Topic coverage | Topics | Countries | Visibility |
| Persona gap | Personas | Brands | Sentiment |
| Prominence | Prompts | Engines | Position |
Persona heatmaps are underused. Buyers ask differently, and a brand can look strong for the generic audience while a specific persona never sees it.
Which tools can build these dashboards
You have two routes: use a platform with dashboards built in, or pipe data into a BI layer.
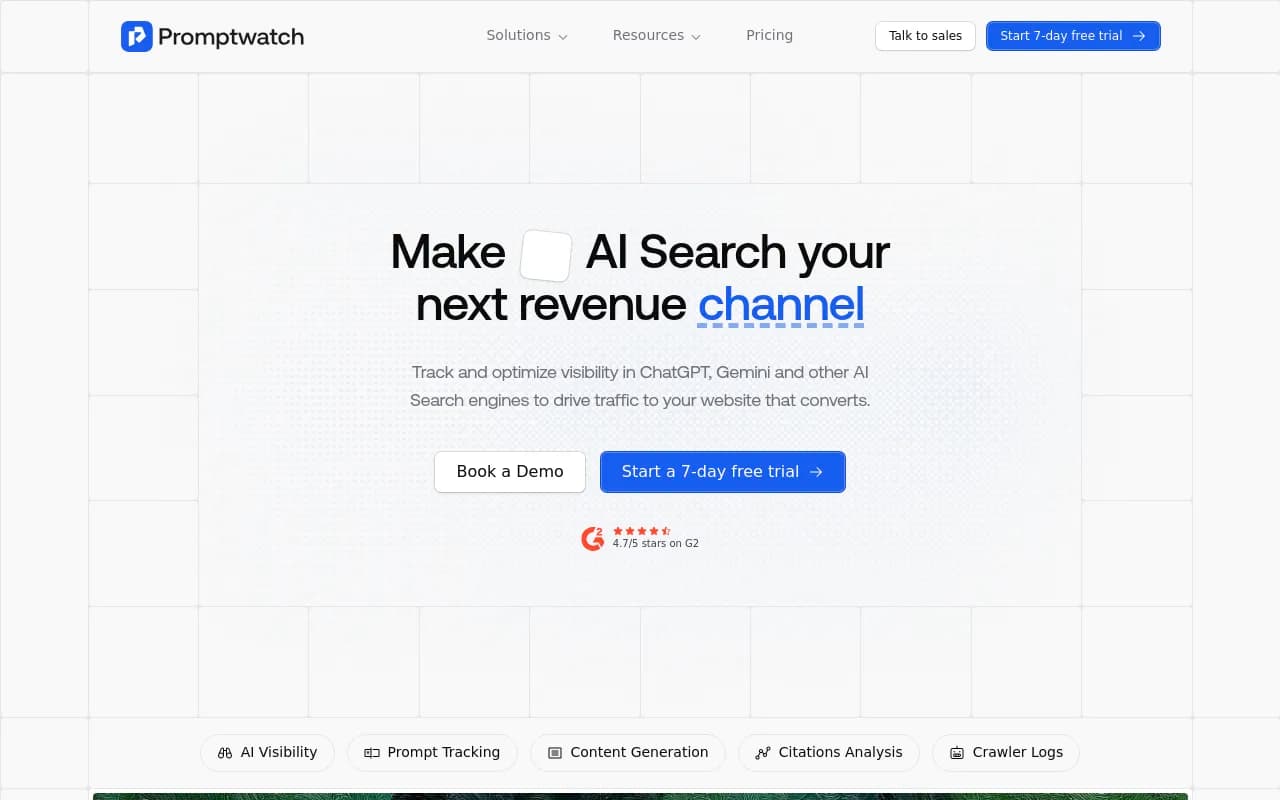
Promptwatch has custom team or personal dashboards with ordered widgets, templates (competitor comparison, topic gaps, AI model breakdown, citations), an A/B chart for comparing periods, and a heatmap that puts brands, models, topics, countries, or personas on either axis. Agent Chat can build a dashboard for you, and scheduled PDF reports follow the dashboard as it changes. It also covers the crawler and traffic side, so Templates 5 and 6 come from the same data. Plans start at $95/mo with a 7-day free trial; confirm on the pricing page.
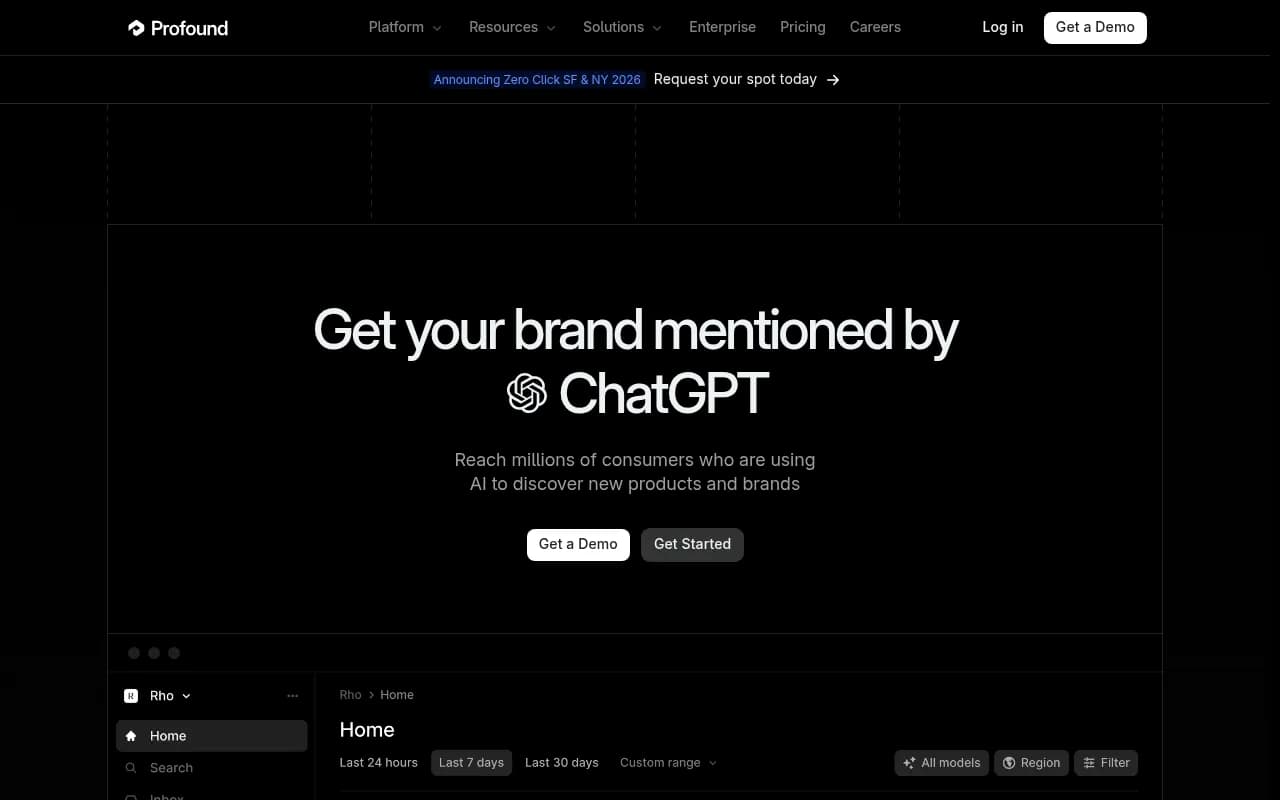
Profound is built for agencies running AEO across many clients, with workspaces and pitch environments, according to its own agency comparison. Take vendor-written rankings with salt, including that one.
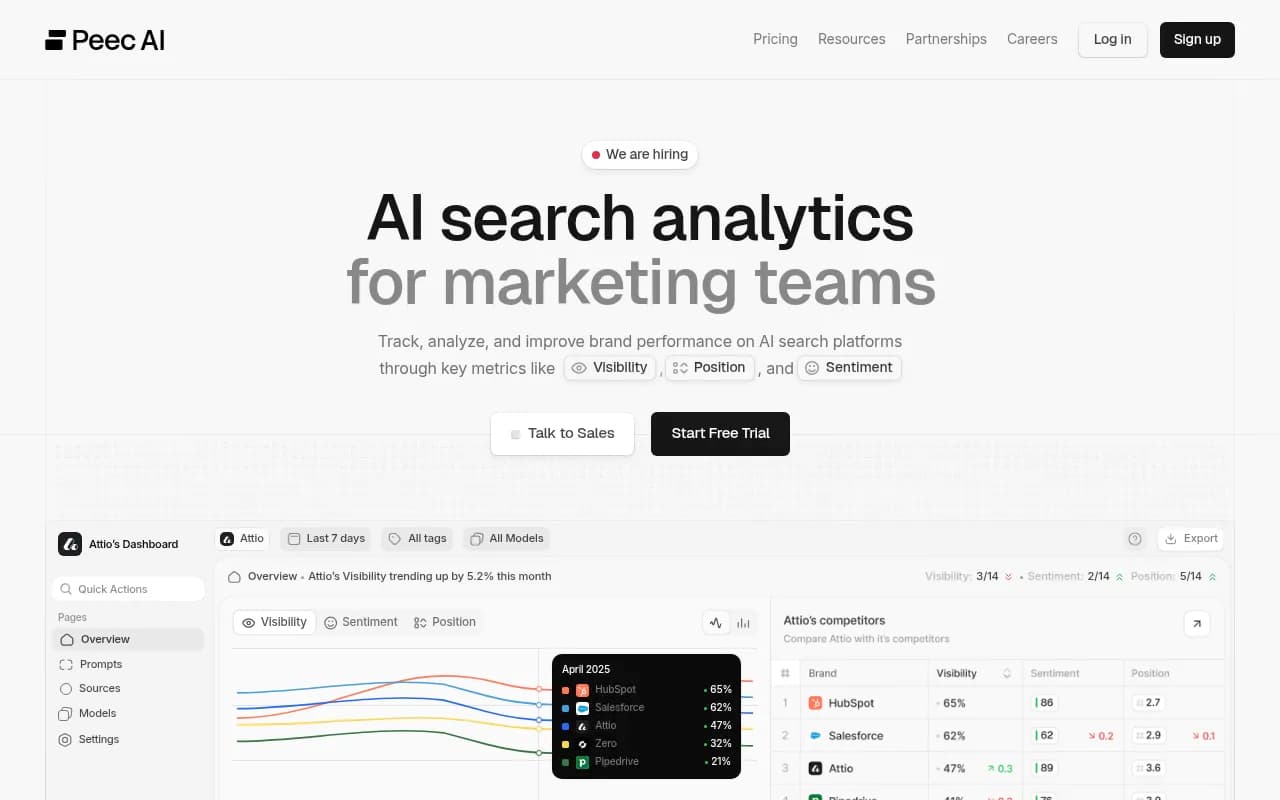
Peec AI is a lighter option for multi-language tracking.
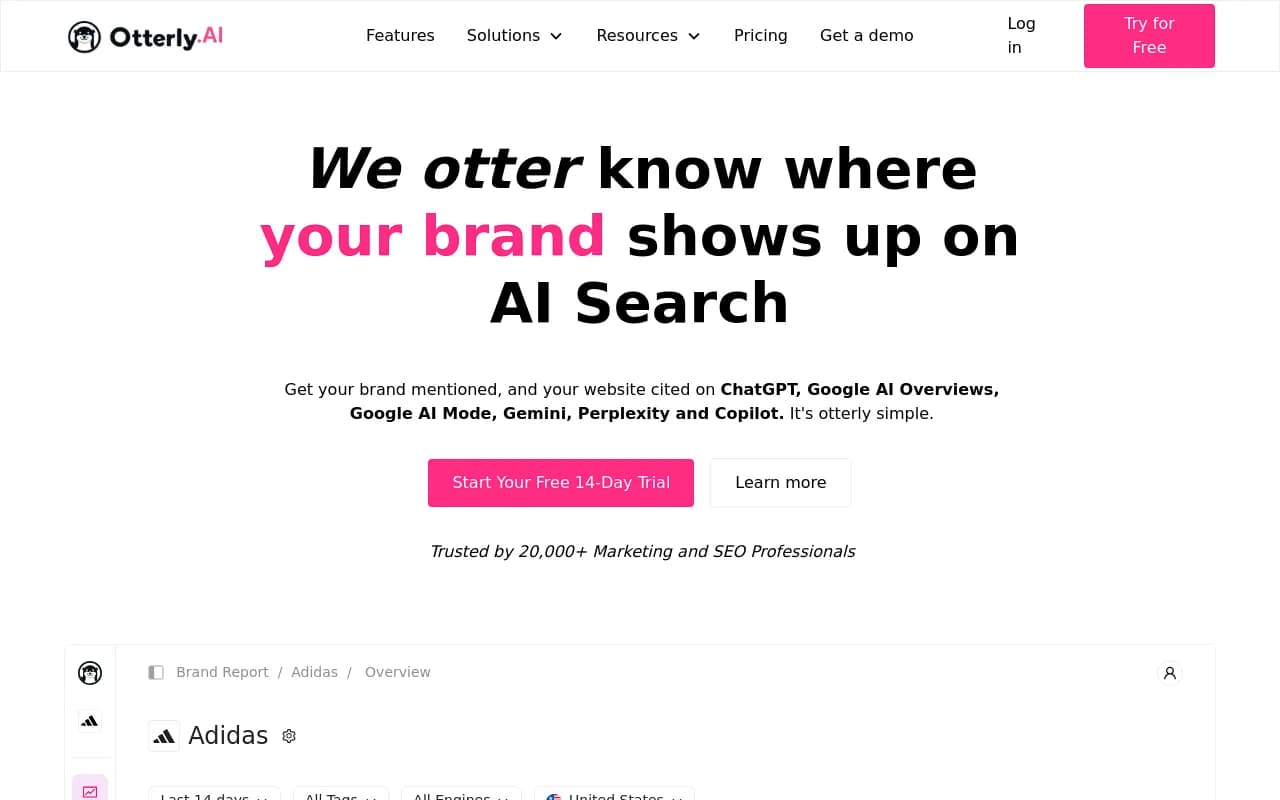
Otterly.AI suits solo marketers who want a cheap start.
For agency-style client reporting, Cairrot and Rankability are built around exactly that workflow.
If you already live in a BI stack, Whatagraph handles marketing reporting for agencies, and Promptwatch has a Looker Studio connector on Professional plans and above.
| Route | Best for | Trade-off |
|---|---|---|
| Built-in dashboards (Promptwatch, Profound) | Fast setup, heatmaps out of the box | Less freedom over layout than BI |
| Reporting tools (Whatagraph) | Agency client reports mixing channels | You still need a data source for AI metrics |
| Looker Studio on top of an AI visibility platform | Blending AI data with GA and CRM | Needs setup and maintenance |
| Spreadsheets and CSV exports | Small teams, one-off audits | Manual refresh |
Supermetrics frames the general choice well in its 2026 marketing tools comparison: pick the tool for the job you do most, then connect the data it needs. Treat that as a vendor view, since Supermetrics sells connectors. For more options in the category, the directory at bestgeosoftware.com lists GEO platforms side by side.
Setting up your first dashboard in a week
- Write down 20 questions your buyers ask AI. The 3RD team suggests the same exercise before comparing tools, and it works.
- Group them into four to six topics and tag prompts by type: organic, brand-specific, and competitor comparison.
- Choose the engines and countries. A monitor's language and location are fixed once created in Promptwatch, so decide before you build.
- Build Template 1 and Template 2 first. Skip the rest until those two are trusted.
- Add annotations for known engine changes and your own publishing dates.
- Assign each panel an owner and a weekly question it must answer.
- Schedule a PDF or Slack briefing so the dashboard comes to people rather than waiting for them.
If you want a structured plan after that, the 90-day GEO program is a reasonable next layer.
Common mistakes
Blending every engine into one number is the big one. Next is comparing windows of different lengths without saying so. Third is treating mentions as the goal: a mention with no citation is fragile, and the citations vs mentions explainer covers why. Last, a dashboard with no actions attached. If a panel never triggers work, delete it.
What to do next
Pick your top three competitors, one topic you must win, and the two engines your buyers actually use. Build the competitor heatmap and the topic gap view, run them for 30 days, and decide from there what earns a spot in the executive summary. If you want to see your starting point before building anything, the free AI visibility report takes a few minutes and needs no login.