Key takeaways
- Apparel and consumer electronics take the biggest share of ad placements in both Google's AI answers and ChatGPT, based on Adthena's Holiday AI Paid Search Report (third-party data, not independently verified).
- Beauty (83%), travel (69%) and toys and games (67%) ran most of their ChatGPT ads on research-style prompts. Apparel (48%) and consumer electronics (42%) were under half.
- Across all industries, Promptwatch Data shows ads in an average of 20.1% of ChatGPT web-search responses between May 20 and Aug 17, 2026, with 32.4% over the last 7 days of that window.
- Organic prompts make up about 73% of ad-bearing ChatGPT responses, but that reflects how many prompts of each type get tracked, not how likely each type is to trigger an ad.
- Industry-level ad data is thin and mostly comes from a few vendors. Treat any single report as one lens, and measure your own category.
Why this question is harder to answer than it looks
Everyone wants a league table: which industry gets the most ads in AI answers? The honest answer is that there isn't one clean dataset. Ads in AI search are new. ChatGPT served no ads at all until May 27, 2026. Google's ads in AI Overviews and AI Mode are labeled "Sponsored" and run through existing Search, Shopping and Performance Max campaigns, with no separate reporting per surface.
So what we have is a patchwork: a first-party view of overall ad frequency from Promptwatch, a paid-search vendor's holiday-category report from Adthena, and a few smaller studies on commercial keywords. I'll lay out what each says, flag where they disagree or stay silent, and then break it down by prompt type, which turns out to matter more than the industry label.
One caveat up front. The industry numbers below come from Adthena's report as covered by Search Engine Journal. They cover only five holiday categories and I could not verify them against the original report. Read them as directional.
How ads get into AI answers
Google's own help documentation explains the mechanics. Ads in AI Overviews and AI Mode are labeled "Sponsored," and Google says paid advertising does not influence the organic AI response. Existing Search, Shopping and Performance Max campaigns are automatically eligible, and both text ads and Shopping ads can appear. Google is also experimenting with local inventory ads and vehicle ads.
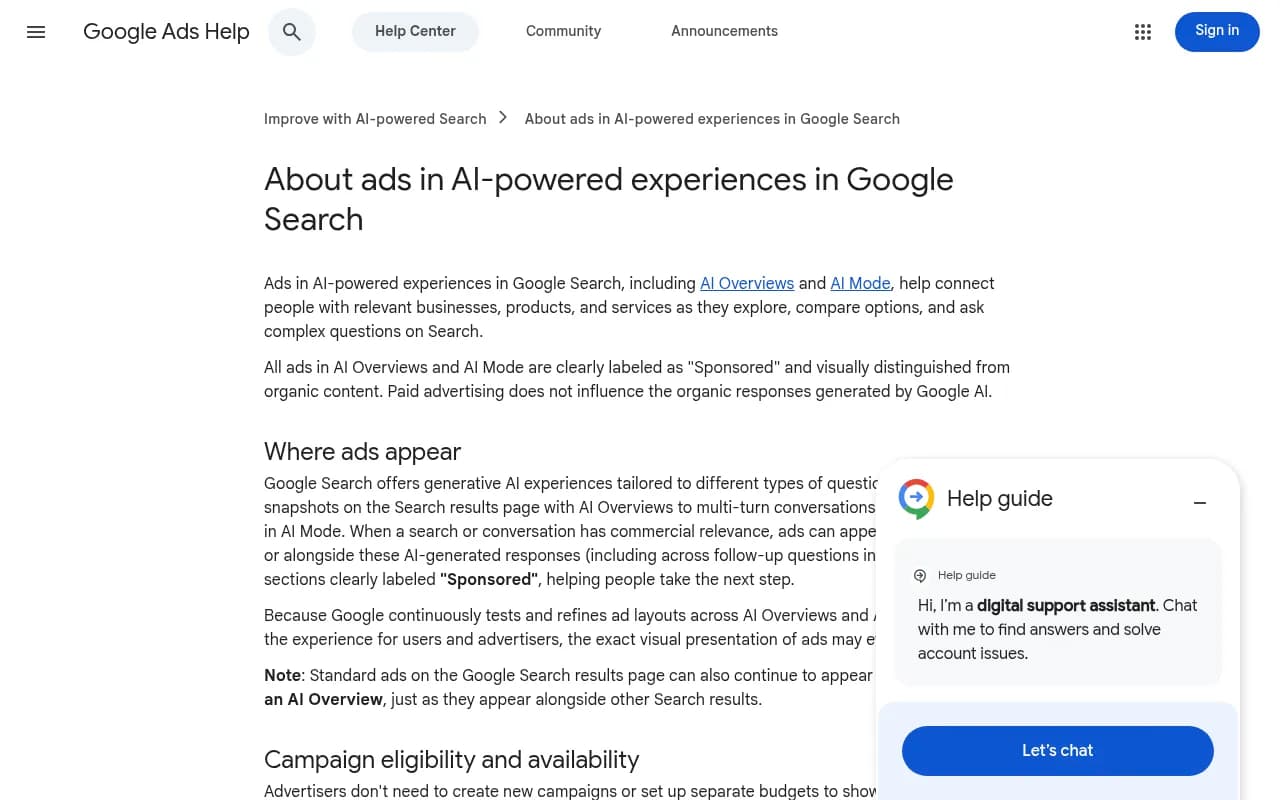
Matching works two ways. Google matches ads directly to the query when commercial intent is obvious, or contextually to both the query and the AI response when a longer, exploratory question develops commercial intent partway through. That second route is why research prompts matter so much. A shopper asking "what is the best moisturizer for dry skin" has no keyword that screams purchase, yet the conversation is clearly heading there.
Sstandard ads can also still show above or below an AI Overview, so "ads in AI search" really means three placements: inside the answer, alongside it, and around it.
For a deeper walk through how advertisers plan for this, the smec webinar on ranking in AI Overviews and AI Mode covers ad placement above, below and within the AI surfaces, and the feed and bidding hygiene that goes with it.
The overall picture: how often ChatGPT shows ads
Before splitting by industry, it helps to know the baseline. Promptwatch Data's ChatGPT ads report tracked 90 days, May 20 to Aug 17, 2026. It only counts responses where ChatGPT searched the web, returned at least one citation, and completed ad extraction.
- ChatGPT showed no ads until May 27. That day ads appeared in 1.69% of responses.
- After a brief spike on June 25 and 26, the rate passed 30% on July 1 and stayed in a band between the low 20s and high 30s. The daily peak was 43.9%.
- Average over the whole window: 20.1%. Past 7 days: 32.4%. Past 30 days: 29.6%.
That is a fast ramp. In under three months a channel that did not exist became something roughly a third of web-search answers can show. Check ad visibility across several days if you monitor this yourself, because a single run can land on an outlier day.
This report is an overall rate. It does not break ads down by industry, so for industries we need third-party data.
Industry breakdown: apparel and consumer electronics lead
Adthena's Holiday AI Paid Search Report looks at five holiday categories: apparel, consumer electronics, travel, beauty, and toys and games. It counted 204,489 ChatGPT ad placements across them. Search Engine Journal's coverage says most belong to apparel and consumer electronics.
ChatGPT ad placements
| Category | ChatGPT ad placements | Note |
|---|---|---|
| Apparel | Largest category (exact count not available in the coverage I reviewed) | Majority of placements sit with apparel and electronics |
| Consumer electronics | 56,569 | Second-largest count |
| Travel | 48,134 | Close behind electronics |
| Toys and games | 4,694 | Advertisers grew 13-fold June to August, from a low base |
| Beauty | 4,575 | Smallest of the five |
The toys and games growth is worth a second look. A 13-fold increase sounds dramatic, and it is, but it started from almost nothing. With under 5,000 placements, it is still a rounding error next to apparel.
Google AI Overviews and AI Mode (US, combined)
| Category | Approx. placements in Google AI answers |
|---|---|
| Apparel | ~111,000 |
| Consumer electronics | ~55,000 |
| Travel | ~6,500 |
| Beauty | ~2,100 |
| Toys and games | ~685 |
The pattern flips for travel. On ChatGPT, travel is a near-peer of consumer electronics with 48,134 placements. In Google's AI answers it falls to roughly 6,500. My read: Google's travel ad inventory lives in other formats (hotel campaigns, things to do) that this count may not capture, while ChatGPT advertisers in travel have gone straight at conversational planning. That is speculation, not something the report states.
McKinsey's AI Discovery Survey (n = 1,927) points the same direction on the demand side: its chart shows consumer electronics and appliances as the sector with the heaviest use of gen AI search to inform purchases. Advertisers go where the research behavior is, and electronics shoppers are researching in AI.
Breakdown by prompt type
Industry is only half the story. What kind of prompt triggers the ad matters just as much.
ChatGPT ads by research prompts, per category
Adthena measured the share of each category's ChatGPT ads that ran on research-style prompts (best-of and comparison queries, per Search Engine Journal's summary):
| Category | Share of ads on research prompts |
|---|---|
| Beauty | 83% |
| Travel | 69% |
| Toys and games | 67% |
| Apparel | 48% |
| Consumer electronics | 42% |
The split is clean. Beauty, travel and toys are categories where people ask for recommendations before buying: "best sunscreen for sensitive skin," "best family resorts in Mexico," "best toys for a 4-year-old." Apparel and electronics carry more of their ads on other prompt types, plausibly more product-specific or transactional queries. That makes sense when a shopper already knows they want a specific laptop model.
Organic, brand-specific and competitor prompts across all industries
Promptwatch Data classifies tracked prompts as organic, brand-specific or competitor comparison. For ad-bearing ChatGPT responses over the past 7 days of the report window:
| Prompt type | Share of ad-bearing responses (7-day avg) | Share over full 90 days |
|---|---|---|
| Organic | 73.3% | 73.1% |
| Brand-specific | 18.0% | 17.9% |
| Competitor comparison | 8.6% | 9.1% |
Promptwatch is explicit about the limitation here: the mix reflects prompt volume. It shows where ads appeared, not how likely each prompt type is to trigger one. If you add more organic prompts to a monitor, their share rises automatically. So do not read this as "organic prompts are 73% likely to show an ad." Read it as "most of the ads we caught were on prompts that did not name a brand."
Still, the direction is useful. Ads in ChatGPT are not confined to people who already know what they want. They show up in the discovery phase, which is exactly where brands have the least control.
Google's side: commercial intent and prompt phrasing
Two other studies add texture on the Google side, with different scopes:
- SE Ranking analyzed 50,032 commercial keywords and found 14,733 returned a text ad in AI Mode, nearly 1 in 3. It also found that a few advertisers win most of the slots. In entertainment and hobbies, 49 advertisers split 2,622 appearances (53.51 each), and in pets, 68 advertisers split 3,514 (51.68 each). At the other end, news and politics had 211 appearances across 81 advertisers (2.6 each) and healthcare had 91 appearances across 36 advertisers (2.53 each).
- A Semrush study of 400 U.S. desktop keywords in banking, ecommerce and software found AI Overviews on 88% of tracked commercial queries in August 2026, up from 45.75% in September 2025. Best-X-for-Y queries reached 96.12%, brand vs. brand passed 86%, and alternatives passed 82%. That measures AI Overview presence, not ads, and the sample is small and desktop-only.
The Semrush finding matters for ads anyway. An ad can only appear in or beside an AI Overview that exists. When AI Overviews cover nearly all comparison and shortlist queries, the inventory for ads on those prompt types grows with them.
Adthena's own detection work adds one more data point: in healthcare, ads appear below AI Overviews about 64.6% of the time, which tells you healthcare advertisers lean on the traditional placement around the answer rather than inside it. Healthcare is a regulated category, and the low in-answer ad counts in SE Ranking's data fit that.
Industries ranked by exposure (a working view)
Pulling the sources together gives a rough ordering. It is a synthesis, not a measured ranking, so I have labeled the confidence.
| Industry | Ad exposure in AI answers | Where the ads sit | Confidence |
|---|---|---|---|
| Apparel | Highest in both ChatGPT and Google AI answers | Mixed prompt types, under half on research prompts | Medium (one vendor) |
| Consumer electronics | Very high, heavy AI research behavior | Mostly non-research prompts on ChatGPT | Medium |
| Travel | High on ChatGPT, low in Google AI answers | Mostly research prompts | Medium |
| Entertainment, hobbies, pets | High per-advertiser density in AI Mode | Commercial keywords | Low to medium |
| Beauty | Low volume, highest research-prompt concentration | Best-of and comparison prompts | Medium |
| Toys and games | Small but fast-growing | Mostly research prompts | Medium |
| Healthcare, news and politics | Lowest in-answer ads | Often below the AI Overview | Low to medium |
What is missing: finance, SaaS, real estate, automotive and B2B. SE Ranking lists finance, ecommerce, real estate, fashion, entertainment, food and healthcare among its categories, but the figures I have do not support a full ranking there. If you work in one of those, treat the table as a prompt to run your own check.
What this means if you are an advertiser
- If you sell in beauty, travel or toys, the ad opportunity is concentrated in best-of and comparison prompts. Landing pages and feeds should answer those questions directly.
- If you sell apparel or electronics, you will face the most competition, and a smaller share of that inventory is on classic research queries. Product feed quality matters more than editorial content.
- Existing Search, Shopping and Performance Max campaigns already qualify on Google. There is no separate budget, but also no per-surface reporting, which makes testing awkward.
- Google said ads in AI Mode are scaling to ten more countries, including Canada and Australia, so geography will change the picture quickly.
What this means if you are not an advertiser
Paid placements sit next to organic citations. If a competitor buys the ad slot on "best travel backpack" and you are not cited organically, you lose twice. Promptwatch Data also shows that ChatGPT's citation behavior shifts fast: product pages were the most cited content type at 22.4% of citations from Sep 28 to Oct 4, 2026. Both paid and organic sides reward clear, product-level pages.
Two things are worth tracking together: whether you appear in the answer, and who is buying the ad on the same prompt. Tools like Promptwatch cover this with its Ads Radar, which shows which advertisers bid on your prompts, their ad copy and landing pages, alongside citation and visibility data and AI crawler logs. Ads Radar is on the Business plan, every agency plan, and Enterprise; confirm current pricing at promptwatch.com/pricing.
Other tools in the category track AI visibility with varying depth. Some relevant ones from the directory:
[tool:kime] tracks AI visibility across nine engines with ad insights.
For a wider list, the GEO software directory at bestgeosoftware.com compares options by feature set.
Quick comparison of tracking approaches
| Approach | Shows ad rate | Shows who is advertising | Shows organic citations | Best for |
|---|---|---|---|---|
| Promptwatch | Yes | Yes (Ads Radar, by ad or prompt) | Yes, plus crawler logs and traffic | Teams that want to act on the data |
| Paid-search intelligence (e.g. Adthena) | Yes, by category | Yes | Limited | PPC teams |
| SE Ranking, Semrush | Partial (AI Mode and AI Overview presence) | Limited | Varies | SEO teams already on those suites |
| Manual spot checks | Anecdotal | Anecdotal | Anecdotal | One-off sanity checks |
How to check your own industry
Published figures will age quickly, so build a repeatable check.
- List 20 to 50 prompts your buyers actually use. Split them into organic, brand-specific and competitor comparison.
- Run them daily across ChatGPT, Google AI Overviews and AI Mode, ideally through the real user interfaces rather than APIs, because user-facing answers and ad placements can differ from API output.
- Record whether an ad appears, which advertiser, and which landing page.
- Compare across several days. One run can hit an outlier.
- Segment by prompt type before you draw conclusions. A category with a low overall ad rate can still have a hot cluster of comparison prompts.
- Revisit monthly. ChatGPT's ad rate moved from 0 to over 30% in about five weeks.
If you are comparing multiple models, the free AI visibility report is a no-login way to see how ChatGPT, Gemini and Perplexity talk about your brand before you set up any monitors.
Limits of the data
- Adthena's numbers are third-party and I did not review the original report. Apparel's ChatGPT count was cut off in the coverage I had.
- The report covers five holiday categories only. Finance, SaaS, automotive and B2B are not in it.
- Placement counts are not rates. A big category with many prompts will have more placements without necessarily having a higher chance of an ad per prompt.
- Promptwatch's prompt-type mix reflects what was monitored, not ad probability.
- Semrush's study is 400 keywords, three industries and U.S. desktop only, and it measured AI Overview presence, not ads or clicks.
Bottom line
Apparel and consumer electronics see the most ads in AI answers right now, and travel is a big player specifically in ChatGPT. Beauty, travel and toys concentrate their ads on research prompts, while apparel and electronics spread across other prompt types. Across everything, about a third of ChatGPT web-search responses were carrying ads by late summer 2026. The practical move is to stop relying on industry averages, pick your twenty most valuable prompts, and watch which ones get paid placements this holiday season.