Key takeaways
- An AI brand perception scorecard turns what ChatGPT, Gemini, Perplexity, Claude and Google AI Overviews say about you into a handful of numbers an executive can read in two minutes.
- Use four core metrics (visibility, favorability, prominence, citation share), then add accuracy and a business-outcome line so the scorecard connects to revenue, not just mentions.
- Report each engine separately and segment prompts into organic, brand-specific and competitor comparison. Blended scores hide the problems.
- Version your methodology. AI engines change retrieval behavior in steps, and a score that jumps because the model changed is not a win.
- Pair the score with one page of evidence (the claims AI makes, the sources it cites) and three recommended actions. Leadership needs a decision, not a dashboard.
Why leadership needs a perception scorecard, not another dashboard
Most executives have heard that buyers now ask ChatGPT or Gemini for shortlists. Few have seen what those tools actually say about their company. When they do see it, the reaction is usually one of two things: "that's wrong" or "why is a competitor listed first?"
A scorecard is how you turn that reaction into a managed process. It does three jobs. It gives a baseline, so you know where you stand. It gives a trend, so you know whether work is paying off. And it gives a short list of causes, so the room can decide what to fund.
The mistake I see most often is treating this as a visibility contest. Being mentioned is the entry fee. What leadership cares about is how you are described (cheap, premium, legacy, risky?), where you land in the answer, and whether the sources behind that description are ones you can influence.
If you want a fuller tour of the tools that collect this data, the directories at bestgeosoftware.com and ai-rank-tools.com list dozens of options. This guide focuses on the scorecard itself.
Step 1: Decide what the scorecard has to answer
Before picking metrics, write down the three to five questions your leadership team would actually ask. Typical ones:
- When a buyer asks AI for options in our category, are we in the answer?
- What does AI say about us, and is it true?
- How do we compare with the two or three competitors the board worries about?
- Which sources are shaping the answer, and can we change them?
- Is any of this sending traffic or pipeline?
Every metric on the final page should map to one of these. If it does not, cut it. Executive scorecards fail from clutter far more often than from missing data.
A useful frame from the research: Handraise describes an AI brand perception strategy as connecting business priorities, brand narratives, earned media, source authority and measurement. Start with the narratives you want to own (for example "best for mid-market finance teams" or "most secure option"), because those become the claims you test for.
Step 2: Choose the metrics
Listen Labs proposes a 10-metric scorecard across five dimensions (visibility, accuracy, sentiment, positioning, recommendation influence) and a leaner four-metric audit (visibility, favorability, prominence, citation share). The IAB's August 2026 framework reportedly groups the same ideas as Presence, Prominence, Portrayal and Persuasion. I could not verify that framework against the primary source, so check it before quoting it in a board deck. The underlying idea is consistent across all of them, and it works.
Here is a version I would put in front of a leadership team:
| Metric | What it answers | How to calculate |
|---|---|---|
| Visibility (mention rate) | Are we in the answer? | Responses mentioning the brand / total responses x 100 |
| Share of voice | How much of the conversation do we own vs competitors? | Our mentions / all tracked-brand mentions |
| Prominence | Do we come first or last? | Average position in the brand list; share of first mentions |
| Favorability | Is the framing positive? | (Recommended + positive - negative) / total mentions x 100 |
| Accuracy | Are the claims true? | Verified-correct claims / total checked claims |
| Narrative fit | Do we get described the way we want? | Share of responses containing your priority claims |
| Citation share | Whose sources feed the answer? | Citations to your domain / all citations |
| Source mix | Owned, earned, review sites, forums | Citations by source type |
| AI traffic and conversions | Does any of this pay? | AI-referred sessions and conversion rate from analytics |
Ten is the ceiling for a one-page view. Six or seven is better.
Why accuracy and narrative fit matter more than most teams expect
Visibility and sentiment are easy to automate and easy to misread. A brand can be mentioned often and described wrongly (outdated pricing, a discontinued product, a past controversy). Accuracy needs a human-defined list of ground-truth facts, then a check of each claim AI makes against it. Narrative fit needs your priority messages written as testable statements.
Some platforms extract the individual claims from responses and let you mark them accurate or inaccurate. Promptwatch does this with Brand Narrative and Fact Check, which also points to the pages on your own site that state the wrong version.
Step 3: Build a prompt library you can trust
The score is only as good as the prompts behind it. Listen Labs suggests a stable library of 15 to 25 buyer queries for the perception scorecard, and 30 to 50 queries run three times per engine for the broader audit. I would start at 30 and grow.
Segment by prompt type
Promptwatch Data shows why segmentation matters. In its ChatGPT unique-domains report (Sep 28 to Oct 4, 2026), 52.5% of organic prompts, where no brand is named, cited 10 or more domains. For brand-specific prompts, the most common count was 5 domains, and only 21.3% reached 10 or more. Comparison prompts looked like organic ones, with 49.1% citing 10 or more.
So the source mix differs sharply by prompt type. On brand-specific prompts, a handful of review sites and forums shape how ChatGPT describes you. A blended score would average that away. Use three buckets:
- Organic category prompts ("best payroll software for 50 employees")
- Brand-specific prompts ("is [Brand] good for enterprise?")
- Competitor comparison prompts ("[Brand] vs [Competitor]")
Write prompts like your buyers, not like your marketing team
Use sales call transcripts, support tickets and Search Console queries. Add personas where your buyers differ (a CFO asks different questions than an IT lead). Keep the wording frozen once the baseline is set. If you must change a prompt, retire the old one and note the date.
Run every prompt more than once
AI answers vary run to run. A single response tells you very little. Run each prompt several times per engine and report rates, not anecdotes. Promptwatch's data makes the same point: measure across many prompts, because one prompt says almost nothing.
Step 4: Report each engine separately
It is tempting to produce one "AI visibility score". Resist it. Engines differ in how many sources they cite, and that changes what a mention is worth.
From Promptwatch's average sources per response data: ChatGPT cites about 5 sources per web-search answer, Google AI Overviews about 10, and Perplexity almost exactly 10 every day. Copilot swung from under 2 to nearly 17 within a few weeks before settling low. That report suggests judging Copilot on monthly trends, and treating Perplexity as a steadier test bench, since changes in your citations there more likely reflect your content than engine noise.
For the scorecard, that means:
- One row per engine (ChatGPT, Gemini, Perplexity, Claude, AI Overviews, Copilot)
- Weekly numbers for steady engines, monthly trend lines for volatile ones
- A note on whether the engine used live web search for the response, since answers without retrieval reflect training data and answers with retrieval reflect current sources
Handraise draws the same line, separating perception without visible web retrieval from perception with it. Training-data perception moves slowly and tells you what is baked in. Retrieval perception moves faster and is where you can intervene.
Step 5: Add the source layer
Leadership will ask the obvious follow-up: why does AI say that? The answer is almost always sources.
A June 2026 arXiv study by Dmitrij Zatuchin, cited by Listen Labs, reportedly found that LLMs ground brand answers in third-party sources 85.7% of the time across 167,551 citations and 128 brands. I have not verified that paper myself, so treat the exact figure with care. The direction fits what citation data shows generally: owned sites are a minority of what AI cites.
The source layer of your scorecard should show:
- Top cited domains for your category and for your brand
- Share of citations by source type (owned, editorial, review sites, forums, video)
- Your own-domain citation rate
- Pages that AI cites about you that contain stale or wrong information
Source behavior shifts quickly, so date every number. Promptwatch Data recorded reddit.com's share of ChatGPT citations falling from about 4% to 0.5% on August 14, 2026, and its social media citations by AI model report found ChatGPT drawing 0.46% of citations from social platforms against 12.2% for Google AI Overviews (Sep 28 to Oct 4, 2026). A source strategy built on one engine's habits can go stale in a week.
Content type matters too. In the ChatGPT content-type report, product pages were the most cited type at 22.4% (Sep 28 to Oct 4, 2026). And the half-life report shows news losing half its cited pages within 36 days, while landing pages and docs last longer. If your narrative depends on press coverage, expect to refresh it often.
Step 6: Version the methodology
This is the step that separates a scorecard leadership trusts from one it abandons after two quarters.
AI engines change how they retrieve in discrete jumps. Promptwatch's query fanout data shows average fanouts per ChatGPT response falling from 2.15 in early December to about 1.84 by early March, then to exactly 1.0 from April, while average query length fell from roughly 117 characters to about 53. Separately, average citations per response dropped around the GPT-5.3 rollout on March 4, 2026.
If your visibility score moved in March, that may have nothing to do with your content. So:
- Keep a changelog of model and retrieval changes next to the trend chart
- Annotate your own interventions (launched a page, got a press hit, fixed a claim)
- Record the prompt library version, run count and date range on every report
- Add a confidence note. Handraise lists "how confident should leadership be in the score?" as a question the report should answer. Sample size and run-to-run variance give you the honest answer.
Step 7: Tie it to business outcomes
Executives will accept a perception score faster if it sits next to something they already trust. Add a small outcomes strip:
- AI-referred sessions and conversions, from analytics
- Share of pipeline or signups where the buyer mentions AI in the source question
- Branded search trend, as a rough companion signal
Attribution is imperfect. Some AI platforms strip referrers, so tag links where you can and be upfront about undercounting. A modest, honest number beats a confident wrong one.
One alternative framing, from AI Marketing Labs' CEO scorecard, groups results under efficiency, effectiveness and risk. That is useful if your CEO thinks in those terms. Perception maps naturally to risk (what wrong claims are circulating) and effectiveness (what share of buyers see you).
Step 8: Choose how to collect the data
You can run the first baseline by hand in a spreadsheet: 30 prompts, four engines, three runs each is 360 responses. It is tedious but it teaches you what to look for. After that, tooling pays for itself quickly.
What to look for:
- Collection from real user interfaces, since answers and citations can differ from API outputs
- Multi-country and multi-language runs if you sell in several markets
- Claim-level extraction for accuracy
- Citation and source classification
- Competitor tracking
- Exports or an API so numbers can reach your own BI tool
| Option | Good for | Watch out for |
|---|---|---|
| Spreadsheet plus manual runs | First baseline, small prompt sets | Does not scale, hard to repeat consistently |
| Promptwatch | End-to-end: tracking, claims, sources, crawler logs, AI traffic, content fixes | Fast-than-daily tracking and Fact Check sit on higher tiers |
| Profound | Enterprise monitoring | Higher price, monitoring-focused |
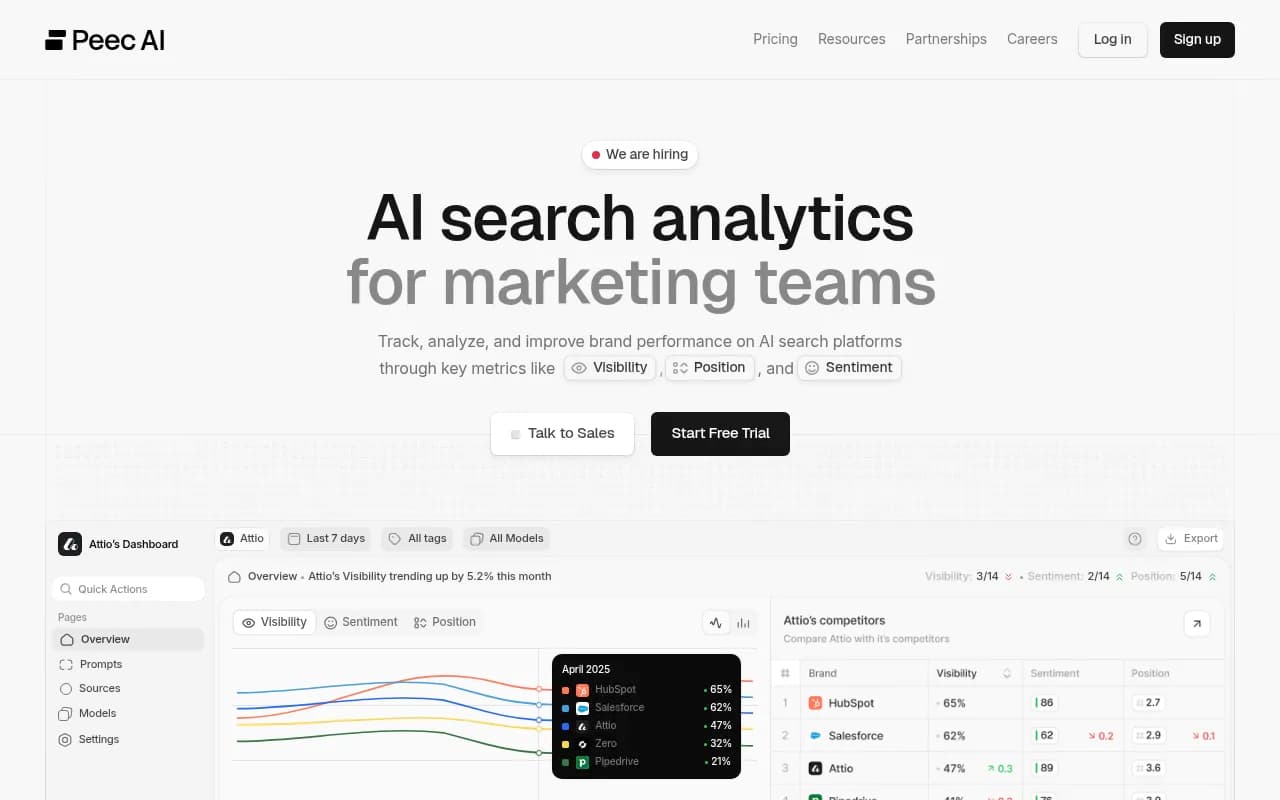
| Peec AI | Lightweight multi-language tracking | Basic tracking, fewer diagnostics |
| Otterly.AI | Affordable monitoring | Limited beyond mention tracking |
| Brandwatch or Meltwater | Existing social and media listening programs | Built for the open web, not AI answers specifically |
Brandwatch Consumer Intelligence
Pricing changes often, so confirm current plans on each vendor's site. For Promptwatch, see promptwatch.com/pricing. If you want a no-commitment first look, its free AI visibility report scans how ChatGPT, Gemini and Perplexity talk about your brand.
One limit worth stating: LLM audits tell you what AI says, not why customers feel the way they do. Listen Labs calls this the say-do gap and recommends pairing audits with customer interviews. If perception shifts and you do not know why, a handful of buyer conversations will explain more than another dashboard.
Step 9: Design the one-page leadership view
A layout that works:
- Headline row. Visibility, share of voice, favorability, accuracy. Each with a number, the change since last period, and a red/amber/green flag against your target.
- Engine table. The same metrics per engine.
- Competitor strip. You against two or three named rivals on visibility and prominence.
- What AI says. The top three positive claims and top three wrong or damaging claims, with the model and frequency.
- Why. The sources behind those claims, with the pages you can fix and the ones you can only influence.
- Outcomes. AI traffic and conversions.
- Decisions requested. Three actions with owner, cost and expected effect.
Keep a methodology appendix on page two: prompt count, runs, date range, model-change notes, confidence.
Setting targets
Do not borrow benchmarks from a blog post. Mention rates and sentiment norms vary heavily by category and competitive set, as Listen Labs itself notes. Run the baseline for four weeks, then set targets as improvements on your own numbers and gaps against your named competitors.
Step 10: Run the cadence
- Weekly: the data team or SEO/GEO owner checks for sharp moves and model changes.
- Monthly: a short written update to the marketing leadership: trend, causes, actions taken.
- Quarterly: the full scorecard to the executive team or board, with a prompt-library review and a decision on investment.
Assign owners by cause. Wrong facts on your own site belong to web or content. Weak third-party coverage belongs to PR or comms. Review-site gaps belong to customer marketing. A scorecard with no owners is a report nobody acts on.
If you do not have in-house capacity to run this, an agency that works on GEO can set it up. 1001 SEO Media is one example, and it uses Promptwatch for AI visibility work.
Common mistakes
- Blending engines into one score. Citation counts and behavior differ too much.
- Changing prompts mid-stream. You lose the trend.
- Counting mentions without reading them. A mention that says "avoid" is not visibility.
- Ignoring accuracy. One wrong pricing claim repeated across models does more damage than low visibility.
- Reporting a single run. Variance will embarrass you in the first review.
- Skipping the actions. A scorecard should end with decisions.
A 30-day plan to get the first version out
- Days 1 to 5: agree the questions, the narratives, and the competitor set with leadership.
- Days 6 to 12: draft 30 prompts across the three types, add personas, freeze the list.
- Days 13 to 20: run the baseline across engines, three runs each, and tag every claim for accuracy.
- Days 21 to 25: map sources and identify the top fixable pages.
- Days 26 to 30: build the one-page view, rehearse the story, and ask for three decisions.
The first version will be imperfect. That is fine. What matters is that the second version, three months later, can be compared with it.
For further reading on how AI engines cite sources, the Promptwatch Data hub collects the research referenced above, and Promptwatch's Academy guide to Visibility Score explains how one scoring method is built.