Key takeaways
- Executives want three answers: are we visible in AI answers, how are we described, and does it move the business. Build the dashboard around those, not around raw mention counts.
- Report visibility per AI engine and label the date window on every number. Source mixes differ sharply by engine, so one blended score hides the story.
- Split results by prompt type (commercial, informational, branded). PR assets like press releases and reviews matter more for branded prompts.
- Show recency, not just cumulative citations. News coverage decays fast in ChatGPT, so a "still cited" rate tells leadership more than a lifetime total.
- End every report with three to five ranked actions, each tied to a finding. Write the executive summary last.
Why the C-suite needs a different PR report
The old PR report is built on reach, clips, share of voice in media, and website clicks. Those still matter. But a growing share of buyers read an AI-generated answer and never click anything. A Pew Research survey from June 2026 found 60% of Americans now read AI summaries at the top of search results. If your report only counts clicks, it understates the channel and misleads the people funding it.
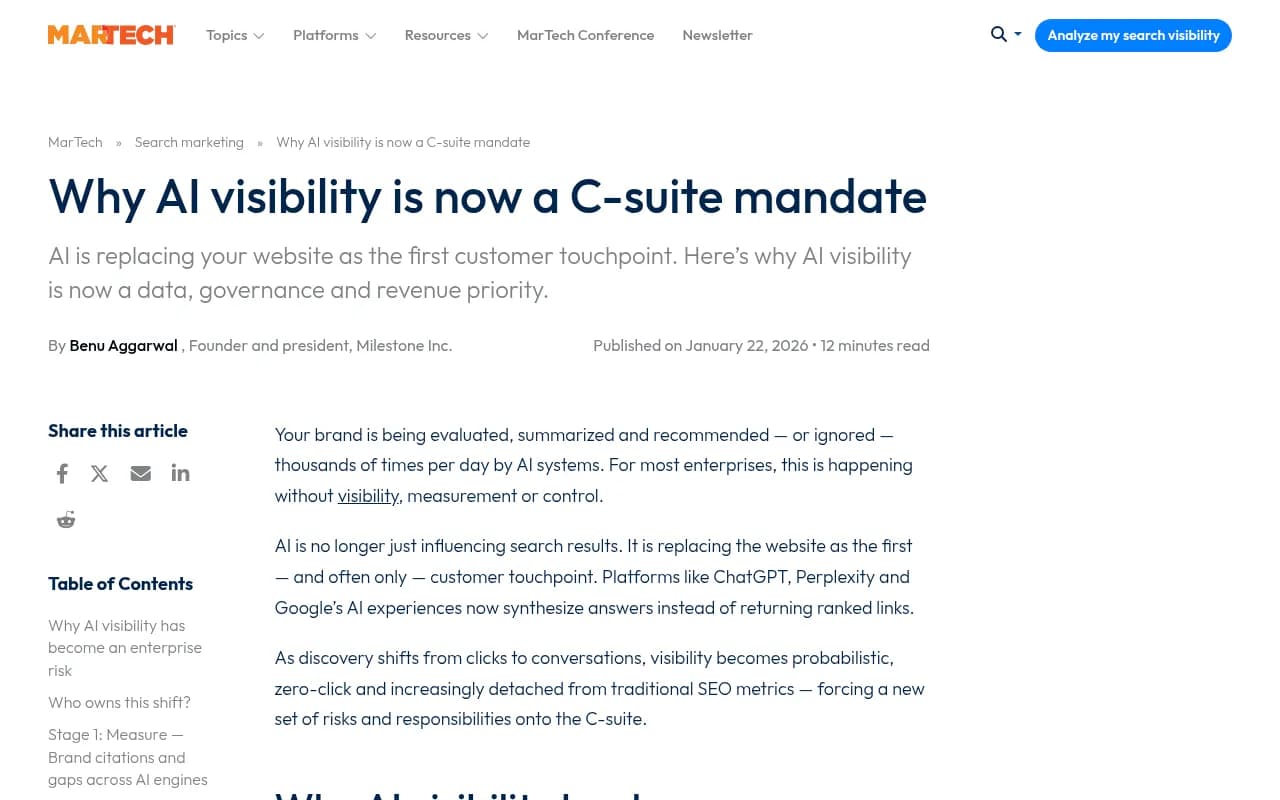
There is also a governance angle. Writing in MarTech in January 2026, Benu Aggarwal of Milestone argued that AI visibility is a data, governance, and revenue issue rather than something to delegate to one SEO. That framing is useful for PR leads. It means you are not asking for attention to a vanity metric. You are reporting on how AI systems describe the company to buyers thousands of times a day.
The other trap is the classic dashboard problem. A SplashBI piece on moving executives from dashboards to decisions makes the point well: static dashboards answer "what happened?" while leaders need "what should we do now?" A PR dashboard that lists metrics without recommending a move gets skimmed and forgotten.
The three questions every executive asks
Before choosing a single metric, anchor on the questions. Anything that does not answer one of them should be cut.
- Are we visible where buyers ask AI? (visibility)
- What does AI say about us, and is it accurate? (narrative and sentiment)
- Does it matter commercially, and how do we compare to competitors? (impact and benchmark)
The Semrush and Cognizo reporting templates both converge on a similar structure, and so does this one. The difference here is the PR lens: sources, narrative accuracy, and the shelf life of earned coverage get their own space.
The dashboard template, section by section
| Section | Question it answers | Core metrics | Cadence |
|---|---|---|---|
| 1. Executive summary | What is the headline? | Visibility Score, change vs last period, one key shift | Monthly |
| 2. Visibility by engine | Where do we show up? | Visibility Score, mention rate per engine | Monthly |
| 3. Narrative and sentiment | How are we described? | Sentiment score, recurring claims, accuracy | Monthly or quarterly |
| 4. Competitive benchmark | How do we compare? | Share of Voice, average position vs named rivals | Monthly |
| 5. Source and citation mix | Where does AI get this? | Owned vs earned vs review vs news citations, still-cited rate | Monthly |
| 6. Business impact | Is it worth it? | AI referral visits, conversions, assisted pipeline | Monthly or quarterly |
| 7. Prioritized actions | What do we do next? | 3 to 5 ranked moves | Every report |
Seven sections is the ceiling. If the board will only read one page, sections 1, 4, and 7 are the page.
Section 1: Executive summary
One current Visibility Score, its direction since the last period, and the single most important change. Two numbers at most. Something like: "Visibility is 41, up 4 points. We gained ground on ChatGPT but a competitor now leads on AI Overviews for commercial prompts." Then the one ask.
Write this section last. You cannot know the story until the rest of the report tells you.
Section 2: Visibility by engine
Never show a single blended number alone. Promptwatch's October and November 2026 data on social citations shows how different the engines are: in the Oct 11 to Nov 9 window, social platforms made up 13.16% of Google AI Overviews citations but only 0.64% of ChatGPT's, and 1.94% of Perplexity's (Promptwatch Data, November 2026). A PR plan built on LinkedIn and YouTube posts will behave very differently across those engines.
A line chart per engine, plus a small table with this month, last month, and change. Label the date window on every figure. Promptwatch's own reports mix 7-day and 30-day windows, and that kind of mismatch is exactly the thing that makes a CFO distrust a chart.
Section 3: Narrative and sentiment
This is where PR earns its seat. Visibility without accuracy is a risk. Show:
- Sentiment score and trend (and which engine is driving a drop)
- The three or four claims AI repeats most about the brand ("affordable for small teams", "weak support")
- Any claim that is wrong, and the page it is likely learning it from
Executives respond to a concrete wrong claim far more than to a sentiment index. "ChatGPT says we do not offer an enterprise plan. We do." That gets a ticket opened.
Section 4: Competitive benchmark
Use the same tracked prompts for you and named competitors, and show Share of Voice and average position side by side. Leadership already thinks in competitor terms, so this is the slide that earns attention. Flag any competitor gaining share faster than you.
Section 5: Source and citation mix
This section is the most PR-specific, and the one with the most useful new data. Break citations into owned, earned media, review sites, social, and press releases, then report what share is still being cited after 30 and 60 days.
Promptwatch's half-life study tracked every page ChatGPT cited on July 6, 2026 for 90 days (Promptwatch Data). The result matters for how you report coverage:
- News pages lose half their citations within about 36 days, and only 41% are still cited at day 60.
- Landing pages and docs hold up best: 78% and 76% still cited at 30 days.
- Comparison pages sit in between, at 72% after 30 days.
So a launch that earns 40 news citations in week one looks great in a cumulative count and mediocre by week six. Show a "still cited" line next to the cumulative total and explain the reason: news is a short burst, owned landing pages and comparison pages are the long-term assets.
Also split by prompt intent. In Promptwatch's content-type data (Sep 28 to Oct 4, 2026), branded prompts cite reviews and press releases more than other intents do, while commercial prompts lean on product pages (26.0%) and landing pages (20.6%) (ChatGPT citation share by content type). That tells a PR lead where a review-collection campaign or a press release actually helps.
Section 6: Business impact
This is the section that survives budget season. Pull AI referral visits and conversions from GA4 and your CRM, and put them next to organic conversions. Be honest about the limits: ChatGPT stopped sending a referrer on October 8, 2026, so unless you count visits tagged utm_source=chatgpt.com, your AI traffic is undercounted. Say that on the slide rather than letting someone discover it in a meeting.
If you cannot yet attribute revenue, report leading indicators: citations to commercial pages, and AI-crawler visits to the pages your PR campaign points at. The Notified analysis of 8,000+ GlobeNewswire releases found the average time to first AI citation was eight hours, with 17% of citations arriving in the first 24 hours. That makes release-level citation tracking a useful early signal for a launch.
Section 7: Prioritized actions
Three to five, ranked, each tied to a finding. Example:
- Correct the enterprise-plan claim: update the pricing page and the two third-party listings AI cites.
- Refresh the comparison page that lost citations in ChatGPT since last quarter.
- Run a review push on the two category sites cited most for branded prompts.
- Shift the LinkedIn effort toward AI Overviews and away from ChatGPT-targeted social posts.
A report that ends with data ends too early.

Metrics glossary for the C-suite
Executives will ask what these mean. Keep a one-line definition in an appendix.
| Metric | Plain-English definition | What a change tells you |
|---|---|---|
| Visibility Score | How prominently and how often AI includes you across tracked prompts | Overall presence |
| Share of Voice | Your slice of all brand mentions versus competitors | Coverage problem if low |
| Position | Where you land in the order of brands in an answer | Prominence problem if late |
| Sentiment | How favorably AI describes you | Reputation problem if weak |
| Citation rate | How often your pages are cited as sources | Content or crawlability issue if mentions lack citations |
| Still-cited rate | Share of pages still cited after 30 or 60 days | Durability of PR coverage |
Read together, these locate the problem. Low Share of Voice means you are not in enough answers. Late position means you appear but not first. Mentions with no self-citations point to a content or crawlability gap.
Tools for building the feed
The template is tool-agnostic, but you need continuous multi-engine data behind it. Manual prompt checks produce stale snapshots and cannot support a trend line.
Promptwatch is the option I would look at first for PR teams that want the full loop: it tracks ChatGPT, Gemini, Perplexity, Claude, Google AI Overviews, and others from the real interfaces, breaks out Brand Narrative claims and sentiment, shows which Reddit, YouTube, and LinkedIn sources AI cites, and ties citations to AI-referred visitors. It also exports PDF reports and scheduled dashboards you can send straight to leadership. Brand Narrative is on every plan, and Fact Check (for flagging the wrong claims in Section 3) is on Business and above. Confirm current plans at promptwatch.com/pricing.
Other tools in the category worth a look:
PR teams that already run media monitoring can keep it for traditional coverage and add an AI layer on top:
| Need | Option | Notes |
|---|---|---|
| Tracking plus content actions and crawler logs | Promptwatch | Monitors, explains, then helps fix and measure |
| Enterprise monitoring | Profound | Strong tracking, higher price tier |
| Already in the Semrush suite | Semrush One | Convenient if you live in My Reports |
| Report structure with a tracking feed | Cognizo | Matches the six-section template |
| Traditional media monitoring | Meltwater, CisionOne | Keep for clips and reach, not AI answers |
For wider comparisons, the GEO software directory at bestgeosoftware.com lists more options.
Common mistakes in executive AI reports
- Judging the channel by referral traffic. Most AI answers show no clickable link, so click-only reporting understates the effect.
- Tracking too few prompts. A handful of head terms misses where competitors quietly win. Cover commercial, informational, and branded prompts across the full buyer journey.
- One blended score. It hides the engine and topic gaps that drive decisions.
- Mixing date windows. If one chart is 7 days and another is 30, say so or fix it.
- Reporting cumulative mentions only. News citations fade, so a lifetime count flatters a launch.
- Treating forecasts as results. The Gartner prediction of a 25% drop in search volume by 2026 dates from February 2024. Present it as a forecast if you cite it at all.
- Delivering data without a decision. If the last slide is a chart, the meeting will end without one.
A one-page version for the board
If you get ten minutes, use this:
- Headline: Visibility Score, change, one sentence of context.
- A small engine table: ChatGPT, AI Overviews, Perplexity, Gemini.
- Competitor Share of Voice bar chart.
- One wrong or damaging claim AI repeats, with the fix owner.
- AI-attributed visits or conversions, with the attribution caveat.
- Three ranked actions with owners and dates.
Put the detail in an appendix and a linked dashboard. Executives who want to dig will dig. Everyone else gets the decision.
Cadence and ownership
Monthly is the right rhythm for most teams: AI answers shift week to week, but a monthly view smooths noise. Run a quarterly review for sentiment, backlinks, and narrative accuracy, and use an alert for sharp drops. Name one owner for the report and one owner for each action. In practice that means PR owns narrative and earned sources, SEO or content owns owned pages and crawlability, and a marketing lead owns the business-impact slide.
If you would rather not build the process in-house, 1001 SEO Media publishes this network and runs GEO programs and reporting for brands that want senior help.
Start here
Pick 30 to 50 prompts that reflect how your buyers actually ask, split them into commercial, informational, and branded groups, set a baseline this month, and ship the seven-section report next month. The first version will be rough. The trend line is what earns trust, and it only exists if you start measuring now.