Key takeaways
- Peak citation rate is not a standard metric. It is a working definition: the highest citation rate your pages reach across a fixed prompt set, in one engine, during a set window.
- A peak means little without context. You need the engine, the prompt set, the slot count per answer, and what happened after the peak.
- Engines differ a lot in citation slots. Perplexity and AI Overviews cite about 10 sources per answer, ChatGPT about 5 on web-search answers, so rates are not comparable across engines.
- Citations decay. Promptwatch Data shows news pages lose half their citations within 36 days, while landing pages and docs hold on far longer.
- Treat third-party benchmarks as rough guides. Compare yourself to your own history first, then to a category median.
What peak citation rate means
I went looking for an official definition of "peak citation rate" and could not find one. No major research report or vendor defines it as a standard metric. So this guide defines it plainly, and you should be careful when someone quotes a "peak citation rate" without saying how they calculated it.
Here is the working definition I use:
Peak citation rate is the highest citation rate your domain reaches, for one AI engine and one fixed set of prompts, within a chosen time window.
Citation rate itself is simple. It is the share of tracked prompt responses that cite at least one of your pages. If you track 200 prompts and 40 of the responses cite you, your citation rate is 20%. The peak is the best that number gets over, say, the last 90 days.
Why bother with the peak at all? Because averages hide the shape. A site that sits at 12% all quarter and a site that spikes to 30% for a week, then falls to 6%, can share the same average. They are in very different situations. The first has a stable asset. The second got lucky, or published something timely, and lost it.
Peak, average and current rate
| Metric | What it tells you | Common trap |
|---|---|---|
| Current citation rate | Where you stand today | Daily noise looks like a trend |
| Average citation rate | Baseline over the window | Hides spikes and collapses |
| Peak citation rate | Ceiling you have proven possible | One-off spikes from news or a model change |
| Retention after peak | How much of the peak you kept | Rarely tracked at all |
The last row matters most. The ratio of your current rate to your peak is a decent health check. If you hit 25% and now sit at 22%, you are holding. If you sit at 8%, something decayed.
Why it matters in 2026
Two things changed. First, rankings no longer predict visibility well. Rankability's 2026 study of 1,645 AI citations found that 55.2% of top-10 AI citations did not rank in the traditional top 10, and that no pair of AI platforms shared more than 24.1% of the pages they cited. Your Google position tells you very little about whether ChatGPT or Perplexity cites you.
Second, citations are volatile. Promptwatch's data on ChatGPT content half-life followed every page ChatGPT cited on July 6, 2026 for 90 days. News pages had a half-life of 36 days, and nearly 25% were never cited again after day zero. A peak built on news content is a short-lived peak.
The practitioner version of this shows up in a Reddit thread on r/DigitalMarketing, where one marketer described a client whose traffic fell 30% with rankings intact, because the brand was being cited in ChatGPT and Perplexity but not clicked. That is anecdotal, but it points at why a citation number alone is not enough. More on that below.
The slot problem: why rates are not comparable across engines
Before you compare any two citation rates, check how many citation slots each engine gives an answer. Promptwatch tracked this in its average sources per response data (published September 2025, so treat the figures as a baseline that may have drifted):
- ChatGPT cites about 5 sources per web-search answer, and the count drifts with model and retrieval updates.
- Google AI Overviews cites about 10 sources, steadily.
- Perplexity cites almost exactly 10 sources every day, which makes it a good test bench. If your Perplexity citations move, it is probably your content and not engine noise.
- Copilot swung from under 2 to nearly 17 sources within weeks, then settled low. Judge it on monthly trends.
More slots means more chances to appear. A 20% rate on a 10-slot engine and a 20% rate on a 5-slot engine are not the same achievement.
The crowding is real too. In Promptwatch's unique domains per ChatGPT response data (September 28 to October 4, 2026), 47.6% of responses cited 10 or more unique domains, and 66.1% cited at least 8. For organic prompts where no brand is named, 52.5% cited 10 or more. Brand-specific prompts were tighter: the most common count was 5 domains, and 40.7% cited 5 or fewer.
So your peak rate depends heavily on prompt type. Branded prompts give you easy wins and a flattering number. Unbranded category prompts are where the real competition is.
How to measure peak citation rate
Step 1: fix your prompt set
Pick prompts that map to how buyers actually ask. Split them into three buckets: organic (no brand), brand-specific, and competitor comparison. Report the rate for each bucket separately. Blending them is how people fool themselves.
Keep the set stable. If you add 50 easy prompts in week six, your "peak" is an artifact. When you must change the set, restart the series and note it.
Promptwatch's own advice is to measure across many prompts, since a single prompt tells you little. A few dozen at the very least per topic, and more is better.
Step 2: measure per engine
Run the same prompts on ChatGPT, Perplexity, Google AI Overviews, Gemini and whatever else your buyers use. Keep a separate series for each. One blended number across engines is close to useless, for the slot reasons above.
Also prefer data collected from the real user interfaces over API calls, since user-facing answers and citations can differ from API output.
Step 3: choose a window and a sampling frequency
Daily sampling for 30 to 90 days is a reasonable default. Weekly snapshots miss spikes and make decay invisible. Use rolling 7-day averages for each point so one odd day does not become your peak.
Step 4: record the peak with its context
When you log a peak, write down five things: the date range, the engine, the prompt bucket, the number of prompts, and what you published or changed in the two weeks before. Without that last one you cannot learn anything from the peak.
Step 5: track retention
Compute current rate divided by peak rate, and the number of days since the peak. Then break the decline down by content type. This is where the half-life data becomes useful.
Reading decay: what the half-life data says
Promptwatch's ChatGPT content half-life report tracked pages cited on July 6, 2026 through the end of the window on October 4. The shape differs by content type:
| Content type | Still cited after 60 days | Notes |
|---|---|---|
| Landing pages | 69% | 78% still cited after 30 days |
| Docs | 67% | ChatGPT cited 93% of docs again later |
| Comparisons | 63% | 72% after 30 days |
| Listicles | 60% | Likely crosses 50% close to day 90 |
| Product pages, reviews, how-tos | about 55% | Half-life of 74 to 77 days |
| News | 41% | Half-life of 36 days; ~25% never cited again |
The window ends at 90 days, so the half-life for landing pages, docs, comparisons and listicles is likely close to or beyond 90 days. Pricing pages count as landing or product pages in this dataset.
What does this mean for peaks? If your peak came from a news piece or a timely announcement, expect it to fade within weeks. If it came from a landing page, docs or comparison content, it should hold. That gives you a plan: use news for short bursts, and keep landing pages, docs and pricing pages accurate as long-term assets.
What lifts the ceiling
The evidence on what raises a citation rate is mixed, and most of it is correlational. Rankability is explicit about this: its findings show relationships in the observed data, not proof that changing one element causes a citation. With that caveat, a few patterns stand out.
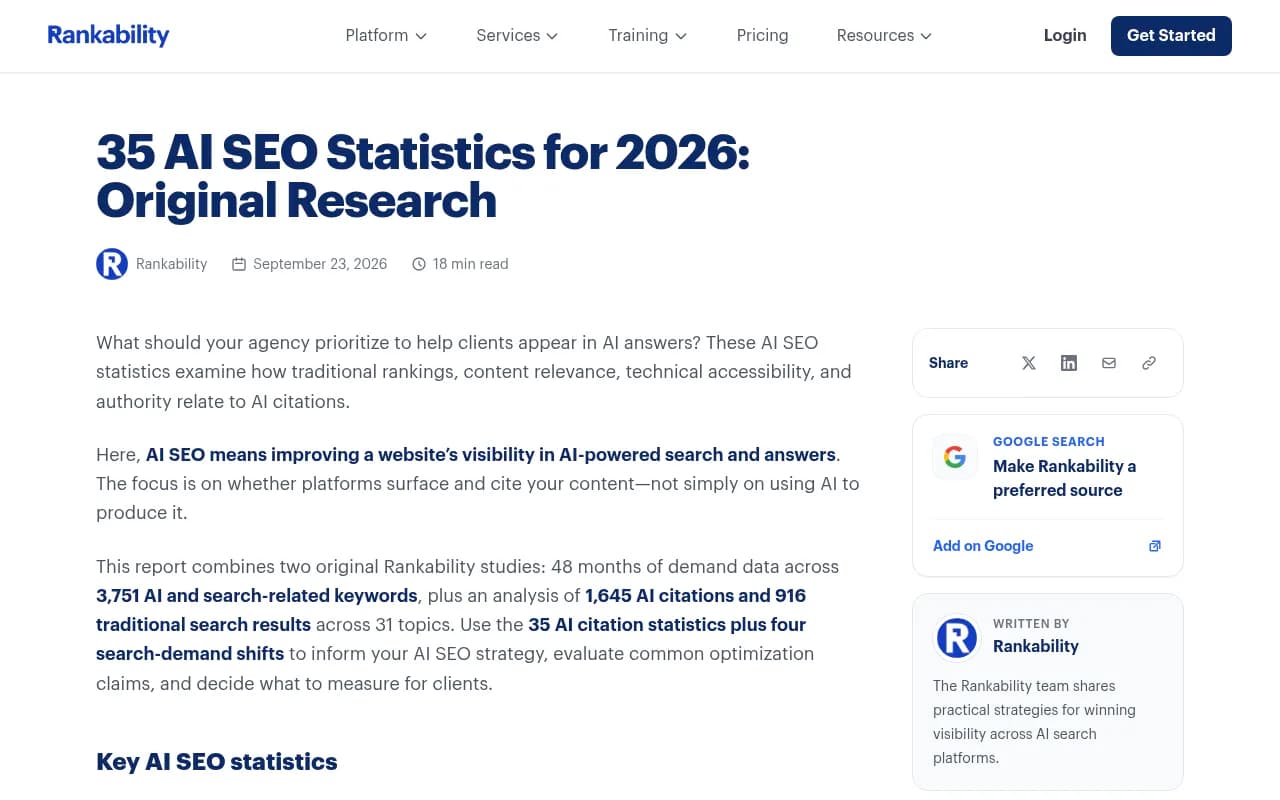
- Thorough topic coverage nearly doubled the top-10 AI citation rate: 27.6% in the highest semantic-coverage quartile versus 14.5% in the lowest.
- Pages that introduced the topic within the first 100 words had a 2.5 times higher top-10 AI citation rate.
- Exact-match titles are not required. Only 4.8% of AI citations came from pages with the complete search query in the title tag, and partial topic matches accounted for 81.2%.
- Title and H1 wording did not need to be identical. Only 22.7% of AI-cited pages used the same wording in both.
- Page-level backlinks were not a prerequisite: 72.8% of AI-cited pages had no page-level referring domains.
Authority patterns are interesting too. Promptwatch's citation share by domain rank data found that sites with domain rank 46 to 75 earned almost half of ChatGPT citations in August 2026, while DR 91 to 100 fell to about 3%. Mid-authority sites are clearly not shut out.
And the content type you publish matters. In the content type breakdown for September 28 to October 4, 2026, product pages were the most cited type at 22.4% of ChatGPT citations, followed by landing pages and listicles.
Do industry benchmarks help?
Some. Siftly publishes median citation rates by industry: B2B SaaS 18 to 28%, local services 15 to 30%, healthcare 10 to 18%, finance 8 to 16%. Its method is a sample of prompts per category tracked monthly across ChatGPT, Perplexity and Google AI Overviews. I could not verify the sample size, and it is vendor data, so I would use it as a sanity check and not a target.
Their core advice is sound though: there is no universal good number. Judge yourself against your category and watch the trend. If you are in healthcare, a 12% rate may be fine. Promptwatch's healthcare citation data shows government and public health sites earn almost half of ChatGPT citations there, which explains why the ceiling is lower for commercial brands.
A warning on another source. One roundup of Q4 2026 citation shares states plainly in its method note that it contains no original measurement. Be wary of any aggregator that repeats other people's figures without saying how they were gathered.
Citations are not the whole picture
Peak citation rate answers "how often am I cited," not "am I cited well" or "does it pay." Pair it with:
- Position and description: where you appear in the answer and how the engine describes you.
- Competitor co-citation: which rivals show up in the same responses.
- Crawl access: whether AI bots can actually read the pages you want cited.
- Referral traffic and conversions: whether citations produce visits. Note that ChatGPT stopped sending a referrer on October 8, 2026, so tag links with utm_source=chatgpt.com where you can.
One other timing data point from a LinkedIn analysis: median time from publication to first citation was 6.81 days, with 75% cited within 18.68 days and 90% within 37.1 days. That is a single practitioner's sample, but it suggests waiting a few weeks before judging a new page.
Tools for tracking it
You can do this by hand with a spreadsheet and a prompt list for a small set of queries. It stops scaling quickly. Most teams use a tracker that stores daily responses so you can chart peaks and decay yourself.
Promptwatch is the platform I would start with for this, because it tracks real-interface responses across ChatGPT, Perplexity, Gemini, Claude and AI Overviews, logs citations over time with first-cited date, ramp-up, peak and decay half-life per cited page, and connects crawler logs and visitor analytics so you can tell an access problem from a content problem.
Its AI visibility report is free and needs no login if you only want a first snapshot. Pricing is at promptwatch.com/pricing.
Other options in the same space:
| Tool | Angle | Worth a look if |
|---|---|---|
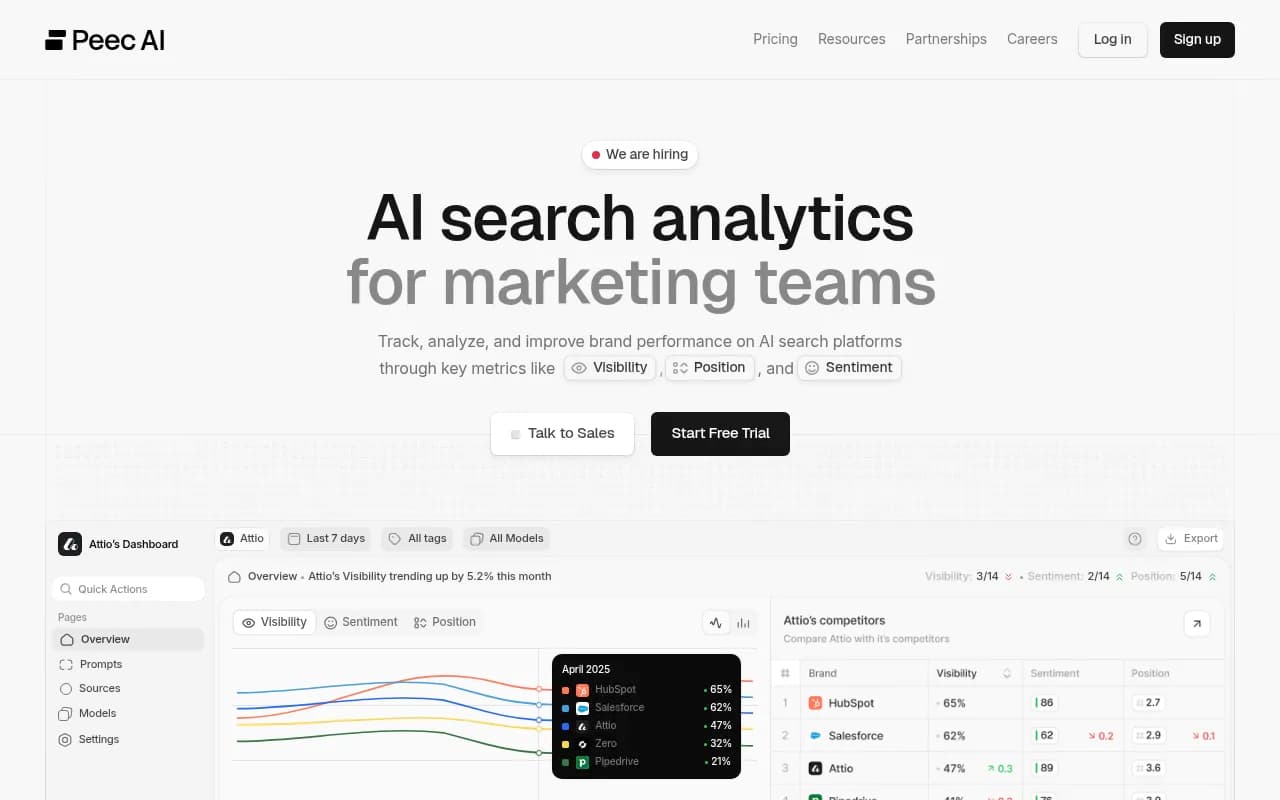
| Peec AI | Multi-language visibility tracking | You run many markets |
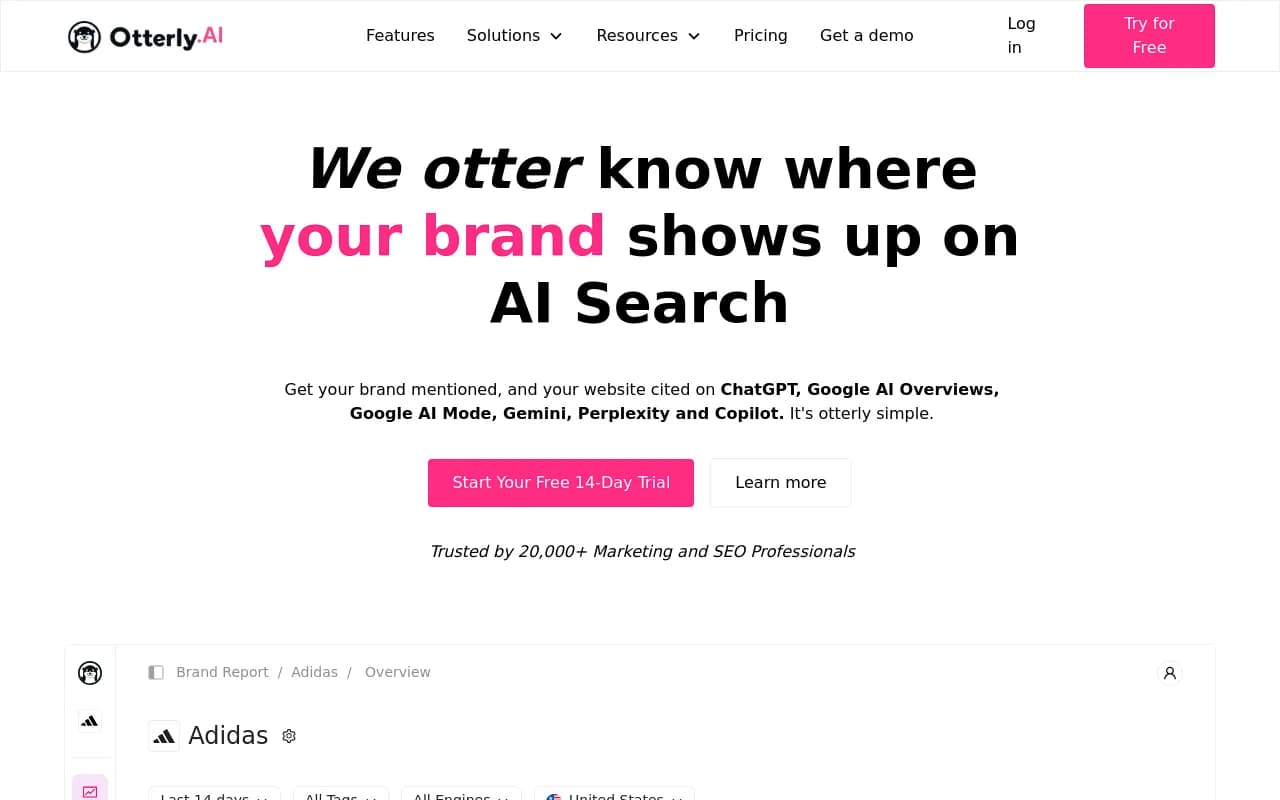
| Otterly.AI | Affordable monitoring | You want a basic tracker on a small budget |
| Profound | Enterprise visibility tracking | You need a large monitoring suite |
| Rankability | Agency-focused analytics | You report to clients |
| Siftly | Tracking plus gap fixing | You want benchmarks alongside tracking |
For a wider list, the GEO software directory covers more trackers by category.
A practical routine
- Build a prompt set of 50 to 150 prompts, split into organic, brand and comparison buckets.
- Collect daily per engine for 90 days. Use 7-day rolling averages.
- Log your peak per engine and bucket, with the date and what you shipped.
- Each month, compute retention: current rate divided by peak.
- If retention drops, split by content type. News and thin pages decay first; refresh the rest.
- Check crawler access and referral traffic before blaming content.
If you want help running this program rather than building it yourself, 1001 SEO Media does GEO and content work for brands, and it uses Promptwatch for the measurement side.
Common mistakes
- Reporting a blended number across engines with different slot counts.
- Changing the prompt set mid-series and calling the high point a peak.
- Mixing branded and unbranded prompts, which inflates the rate.
- Treating a single-day spike as a result. Use rolling averages.
- Reading a peak as causal. Correlation is what most of the data gives you.
- Ignoring decay. A peak you cannot hold is a news cycle, not a position.
The bottom line
Peak citation rate is a useful number only when you define it tightly: one engine, one prompt set, one window, a rolling average. Report it alongside retention, since the content type behind your peak decides how long it lasts. Start with 90 days of daily data, and the first thing you will probably learn is how much of your best week came from pages that were already fading.