Key takeaways
- "Peak citation rate" is not an established metric. In this guide it means the highest point of citations per response, or of a domain's citation share, over a window you choose.
- Promptwatch Data shows Perplexity at almost exactly 10 sources per answer, AI Overviews at about 10, and ChatGPT at about 5. Perplexity and AI Overviews barely move, so their curves are flat.
- ChatGPT's curve is a step function. Model rollouts, like GPT-5.3 on March 4, 2026, change citations per response overnight.
- Inside ChatGPT, individual pages decay on their own schedules. News fades in weeks, landing pages and docs last for months.
- Third-party figures (Perplexity at 21.87 citations per answer) conflict with current UI-based data. Treat them as dated.
What "peak citation rate" actually means
Let me be upfront: nobody has published a standard definition. When people talk about a peak citation rate they usually mean one of three things.
- The highest average number of citations per response an engine reaches in a period.
- The highest daily citation share a single domain reaches.
- The moment a specific page is cited most often before it decays.
The three engines differ on all three, but for different reasons. The first is mostly about the engine's architecture. The second is about what the engine prefers to cite. The third is about how long the engine keeps a page in its working set. Mixing them up is the fastest way to misread a chart, so decide which one you are measuring before you open a dashboard.
Citations per response: the baseline that shapes every curve
According to Promptwatch Data's report on sources per response, which tracks ChatGPT messages where web search was triggered, the three engines look like this:
| Engine | Typical sources per answer | How the curve behaves |
|---|---|---|
| ChatGPT | About 5 (6.4 before March 2026, 4.7 to 4.9 after) | Step changes after model or retrieval updates |
| Google AI Overviews | About 10 | Steady over time |
| Perplexity | Almost exactly 10 | Nearly flat, a decimal of movement day to day |
| Copilot | Swung from under 2 to nearly 17, then settled low | Unstable, still being re-architected |
Older third-party research tells a different story. Qwairy's Q3 2025 study of roughly 118,000 answers reported Perplexity at 21.87 citations per response against 7.92 for ChatGPT, and the AI Citation Behavior Index repeats it. I would not build a plan on those numbers. They come from a single vendor, they are older, and they disagree with current monitoring of the real interfaces. The direction (Perplexity cites more than ChatGPT) holds up. The size of the gap does not.
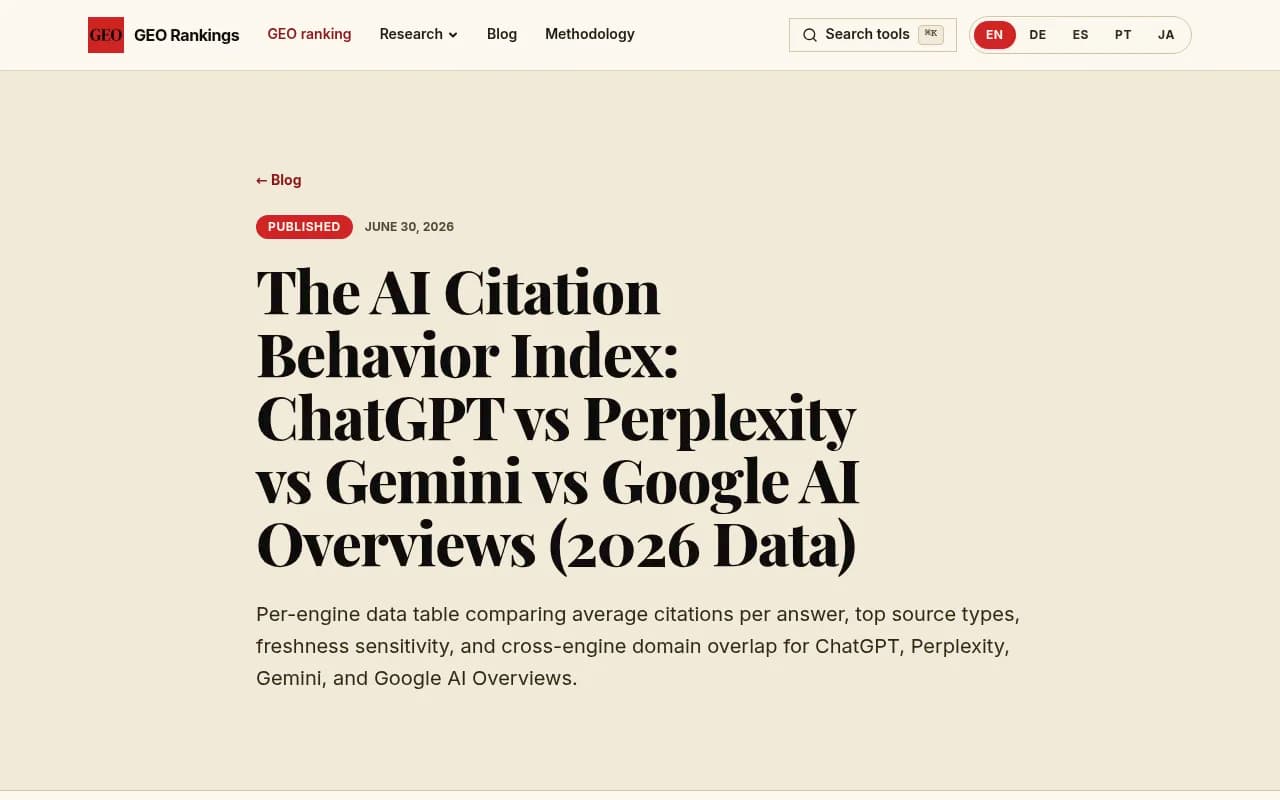
The screenshot above shows the older Qwairy-based comparison. Useful for context, but check the dates before quoting it.
Why Perplexity's curve is flat
Perplexity retrieves live results for essentially every query and fills a fixed number of source slots. When the slot count stays at about 10, the ceiling on citations per response is the same every day. There is no room for a spike.
That makes it, in my opinion, the best test bench for GEO work. If your domain's citation share on Perplexity moves, the cause is probably your content, not engine noise. Promptwatch Data makes the same suggestion: use Perplexity to test changes because the stable slot count isolates your effect.
Source mix is a separate question. Profound's data (older, but the most detailed breakdown available) found Reddit at 6.6% of all Perplexity citations, and a very large share of the top-10 sources. PikaSEO's compilation puts Reddit at 24% of Perplexity top citations, down from a 46.7% peak in 2025. Those figures vary by method, so read them as "Perplexity leans on community content, and that lean has been shrinking."
Why Google AI Overviews is flat too
AI Overviews also sits near 10 sources per answer and stays there. The engine is built on top of Google's index, so retrieval is anchored to a system that changes slowly compared with a chatbot's model layer.
What does move in AI Overviews is the content type mix. Promptwatch Data's July 2026 citation types report shows product pages overtaking listicles as the most cited format in late July. The total count stayed put while the composition shifted. That is a different kind of curve: flat height, changing colors.
Social sources matter more here as well. In the week of Sep 28 to Oct 4, 2026, Promptwatch Data found that AI Overviews drew 12.2% of citations from social platforms, while ChatGPT drew 0.46%. If your peak is driven by YouTube or Reddit threads, expect it on AI Overviews, not ChatGPT.
Promptwatch also suggests treating AI Overviews as a beachhead for newer or mid-authority domains, since it spreads citations across more sources per answer than ChatGPT does.
Why ChatGPT's curve is a staircase
ChatGPT is the odd one out, and the reason is simple: OpenAI changes retrieval behavior often, and the changes land everywhere at once.
A few examples from Promptwatch Data:
- On March 4, 2026, GPT-5.3 rolled out. Citations per response fell across GPT-5.3, GPT-5.4 and GPT-5-Mini within about a day. The week before, the average was about 6.4 sources per search-enabled response. By late March it was 4.7 to 4.9, roughly 27% fewer, with no recovery a month later.
- On August 8, 2026, ChatGPT started using the site: operator at scale. Site: queries jumped from about 0.4% to about 17% of fan-out queries overnight, and searches per response nearly doubled.
- On August 14, 2026, reddit.com's share of ChatGPT citations fell from about 4% to 0.5%.
None of those are gradual. They are cliffs. If your brand's citation rate fell on March 5, the first thing to check is the release calendar, not your content.
There is another consequence. Because ChatGPT cites fewer sources per answer, each slot is more contested, and the mix can flip fast. Promptwatch Data's August 2026 citation types report shows product pages leading at roughly a third of citations in July and slipping to about 25% late in August, while how-tos more than doubled. Same engine, same month, different winners.
Domain authority behaves oddly too. In August 2026, sites with domain rank 46 to 75 earned almost half of ChatGPT citations, while DR 91 to 100 fell to about 3%. Third-party benchmarks have claimed ChatGPT is hard on small sites. The first-party data suggests the middle tier is doing fine.
Page-level curves: how long a citation lasts
So far we have talked about engine-wide curves. The third meaning of peak citation rate is about a single page: it gets cited, peaks, then fades. Promptwatch Data's content half-life report tracked every page ChatGPT cited on July 6, 2026 for 90 days.
| Content type | Still cited after 30 days | Still cited after 60 days | Notes |
|---|---|---|---|
| Landing pages | 78% | 69% | Likely half-life near or beyond 90 days |
| Docs | 76% | 67% | 93% were cited again after day 0 |
| Comparisons | 72% | 63% | |
| Listicles | n/a | 60% | |
| Product pages, reviews, how-tos | n/a | 55% | Half-life of 74 to 77 days |
| News | n/a | 41% | Half gone after 36 days; almost a quarter never cited again |
So a news article has a sharp peak and a fast decay. A docs page has a lower, wider hump. If you compare the "peak" of those two on a chart without separating content types, you will conclude the docs page is underperforming when it is actually just durable.
The report's practical advice is worth repeating: treat landing pages, docs and pricing pages as long-term citation assets, keep product-page specs and prices current, invest in comparison pages and listicles, and use news for short bursts.
Why the overlap is so low
One more thing explains why a curve that peaks on one engine can be flat on another. Profound's July 2025 study of 100,000 prompts found only about 11% cited-domain overlap between ChatGPT and Perplexity, and Ahrefs found roughly 13.7% overlap between AI Overviews and AI Mode. These are older single-vendor figures, but the order of magnitude matches what most people see in practice. Different retrievers, different source preferences, different citations. A win on one is not evidence of a win on another.
PikaSEO's compiled breakdown shows how different the source mixes are, with ChatGPT leaning on Wikipedia far more than the others and Gemini and AI Overviews leaning on YouTube.
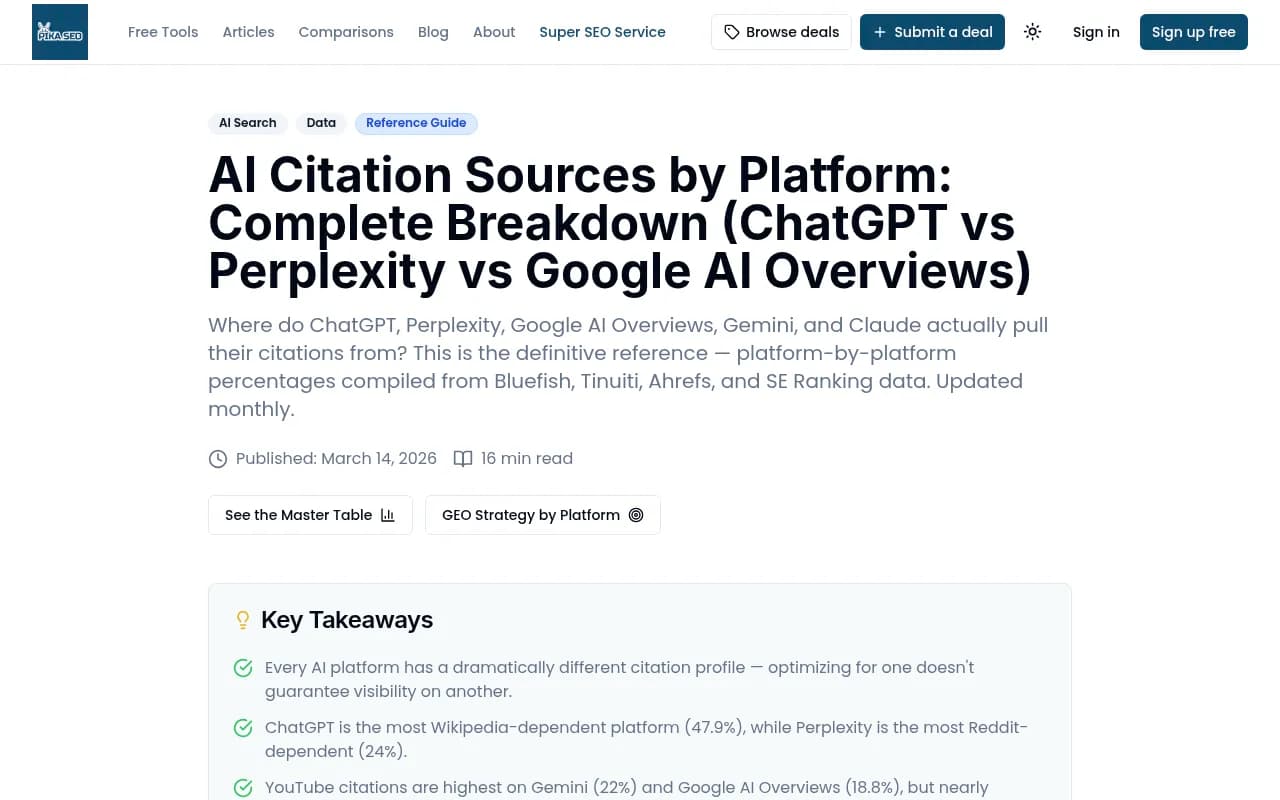
Treat the percentages as one study's snapshot. The shape of the differences is the useful part.
Summary: what drives each curve
| Driver | ChatGPT | AI Overviews | Perplexity |
|---|---|---|---|
| Slots per answer | About 5, variable | About 10, stable | About 10, very stable |
| Main source of change | Model and retrieval rollouts | Content type mix shifts | Source mix shifts, slowly |
| Curve shape | Step function | Flat line, changing composition | Flat line |
| Social citations | Minimal (0.46%, Oct 2026) | Substantial (12.2%) | Community-heavy |
| Best use | Track page-level decay | Beachhead for mid-authority domains | Clean test bench for content changes |
How to measure peaks without fooling yourself
Pick one definition and stick to it
Decide whether you are tracking citations per response, domain share, or page-level peaks. Do not switch halfway through a quarter.
Annotate your charts with release dates
Keep a running list of model launches and retrieval changes (GPT-5.3 on March 4, the site: operator on August 8, Reddit's drop on August 14). A dip that lines up with one of those dates is not your fault.
Split by content type
News and docs have very different curves. Averaging them hides both.
Use daily data, not snapshots
ChatGPT can change overnight, so a single monthly audit tells you very little. Daily tracking across engines, in the real interfaces rather than only APIs, is the only way to see steps and plateaus clearly. Tools like Promptwatch do this, and its prompt tracking and citation trends views give you the per-engine curves described here.
Separate access problems from content problems
If a page never gets cited, check whether AI crawlers can even read it. IP-verified AI crawler logs show whether GPTBot, PerplexityBot and others are reaching the page, so you can tell a crawl failure from a weak page.
Other tools worth knowing
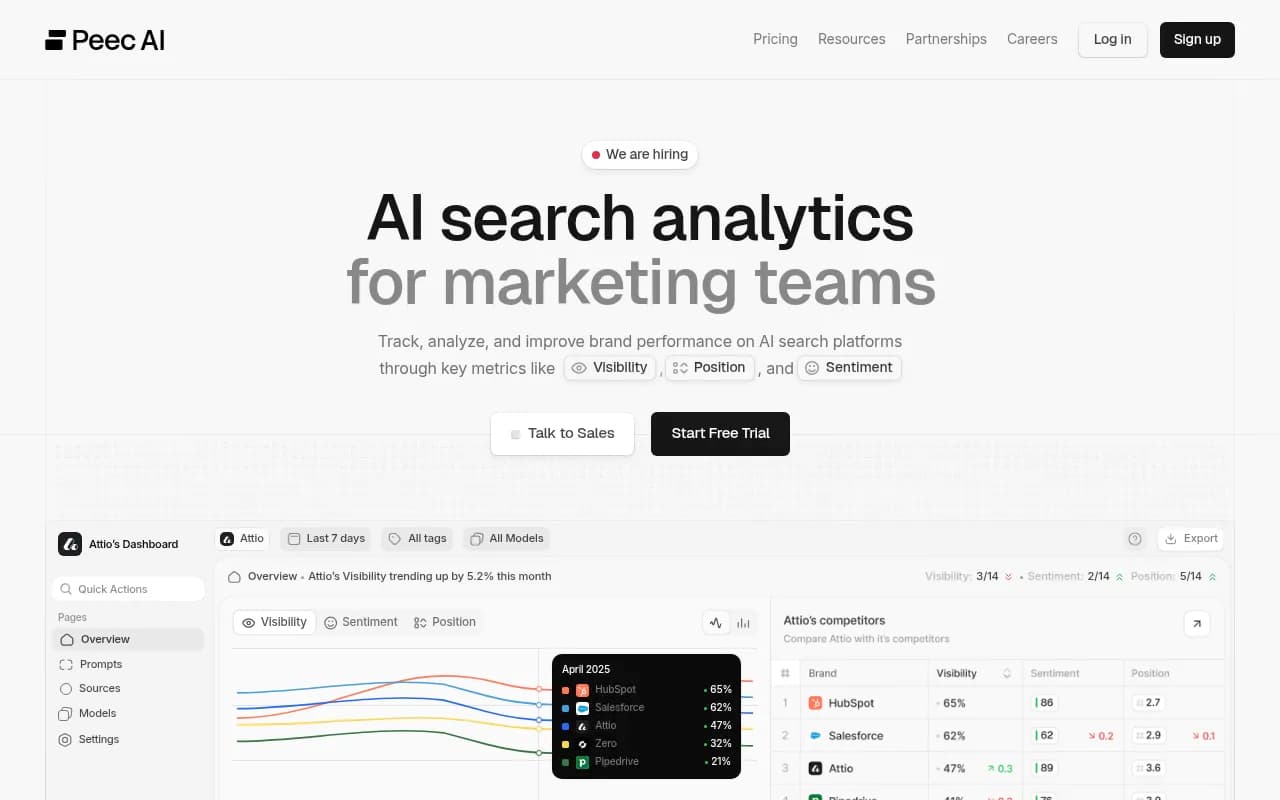
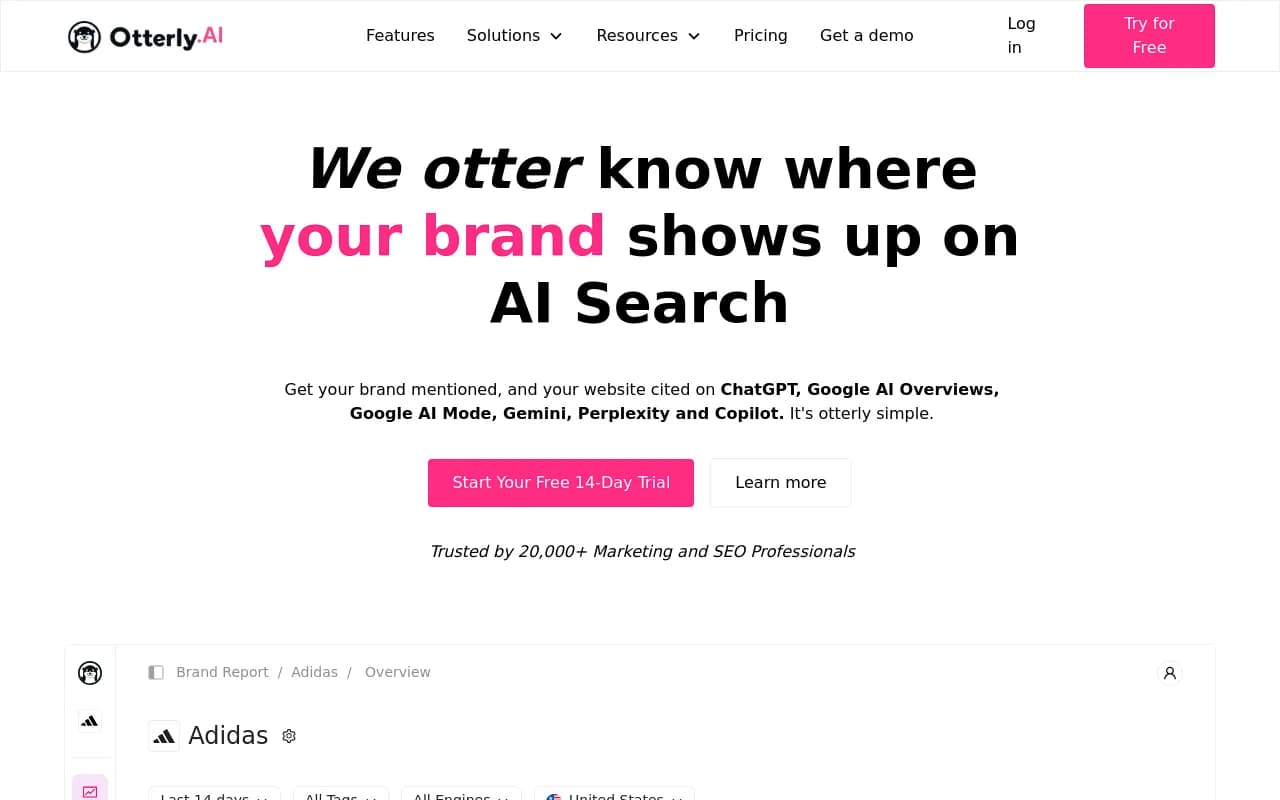
Several alternatives track citations across engines, with different depth. Profound and Peec AI are the most common names in comparisons, and Otterly.AI is a lighter option for basic monitoring. For a broader list, the GEO software directory is a good place to compare.
Most of these stop at reporting. If you also want help acting on what the curves show, look for tools that connect tracking to content and crawler data.
What I would do with this
If I were setting up measurement tomorrow, I would run Perplexity as the control, because it is the quietest. I would watch AI Overviews for content-type shifts, especially if I had social or video assets. And I would treat ChatGPT as a moving target: daily tracking, a release calendar next to the chart, and long-lived pages (landing, docs, pricing) as the foundation, with news only for bursts.
The curves differ because the engines are built differently. Fixed slots produce flat lines. Frequent model changes produce staircases. Once you know which one you are looking at, the chart stops being mysterious.
If you want to see where you stand before building anything, the free AI visibility report scans how ChatGPT, Gemini and Perplexity talk about your brand, and Promptwatch's 7-day free trial covers the daily tracking. Confirm current plans at promptwatch.com/pricing.