Key takeaways
- Four KPIs do most of the work: Visibility Score (presence), Share of Voice (competitive standing), Position (prominence), and Sentiment (quality of the mention). Each one answers a different question.
- Set targets as trends over many prompt runs, not single readings. AirOps testing cited by Local Dominator found only about 30% of brands stay visible from one AI response to the next.
- Segment every KPI by platform, prompt type (organic, brand, comparison), and topic. A blended number hides the problem.
- Read the metrics together. Rising visibility with falling sentiment is a warning, not a win.
- Tie KPIs to business outcomes like AI-referred traffic and conversions, or leadership will treat the dashboard as vanity.
Why rankings and traffic are the wrong scorecard
In classic SEO you reported rankings, clicks, and impressions. Those assume a list of links and a visit. AI answers work differently. A buyer asks ChatGPT for a recommendation, the model names a handful of brands, describes each, and often resolves the question with no click at all. Nothing shows up in Search Console.
So the KPI set has to change. You need to know whether AI names you, how you compare to rivals, where in the answer you appear, and how you are described. Those are the four KPIs this guide builds a plan around.
One more thing before the definitions. AI answers are probabilistic. AirOps repeated-prompt research, quoted by Local Dominator, found only 30% of brands stay visible from one response to the next and just 20% across five consecutive runs. Checking a prompt once and calling it a ranking is close to meaningless. Every KPI below should be an aggregate across many prompts and repeated runs.
The four core KPIs
Visibility Score
Visibility Score is the presence metric. In its simplest form it is the percentage of tracked prompts where your brand is mentioned. Track 200 prompts, appear in 60, and you are at 30%. Cognizo calls it the AI equivalent of impressions, and that is a fair mental model.
Some platforms use a composite 0-100 version instead. TopCited describes a score combining citation frequency, response position, and sentiment. Promptwatch's Visibility Score is also 0-100 and is based on placement, share of attention, and depth. Both approaches are valid, but you must know which one you are looking at before you set a target. A mention rate and a composite score are not interchangeable numbers.
For reference, Presenc AI suggests established brands typically sit between 35 and 70 percent mention rate depending on category competitiveness, below 15 percent signals structural absence, and above 80 percent usually means your prompt set under-samples competitive queries. Treat those as rough ranges from one vendor, not industry law.
Share of Voice
Visibility Score says how often you appear. Share of Voice says how that compares with everyone else. The formula is simple:
AI SoV (%) = your brand mentions / total mentions across all tracked brands in the same prompt set x 100
If you get 40 mentions, and competitors get 80, 60, and 20, the total is 200 and your share is 20%. TopCited and Visiblie both use this exact worked example.
Two rules keep it honest. First, lock the competitor set. If you add or drop a rival halfway through the quarter, the trend is meaningless. Second, run every brand on the same prompts. Presenc AI notes that healthy values depend on category structure: a leader in a concentrated category of 3 to 5 players might hold 35 to 50 percent, while in a fragmented category of 10+ players the leader might hold only 18 to 25 percent. So a 20% share can be dominant in one market and mediocre in another.
Also watch the relationship between SoV and raw mentions. Visiblie makes a useful point: declining share while total mentions grow means a competitor is displacing you, even though your own numbers look fine.
Position
Position is the most neglected KPI of the four. Being named is one thing. Being named first, in the recommended shortlist, is another. Position measures where in the answer your brand appears, and for cited sources where your domain lands in the list.
This matters more than it first seems. Promptwatch Data's report on unique domains per ChatGPT response (Sep 28 to Oct 4, 2026) found that 47.6% of responses cite 10 or more domains, and 66.1% cite at least 8. When a response is that crowded, being on the list is table stakes and your place in it is where the differentiation lives. See Promptwatch's data on unique domains per ChatGPT response.
Presenc AI adds a click-through angle: first-position citations earn 4 to 5x the click-through of fifth-position citations, per their reference guide. That is a vendor figure, so use it as a directional argument rather than a forecast.
Practical target: average position across mentions, plus the share of responses where you are named in the top few brands. Report both.
Sentiment
Sentiment captures whether AI frames you positively, neutrally, or negatively. Cognizo's warning is worth repeating: rising visibility with falling sentiment means AI is naming you more often but describing you worse.
Semrush makes the related point about accuracy. A citation that misstates your pricing or positioning can do more harm than no citation. So track two things: tone, and factual correctness of the description.
On Promptwatch, sentiment is scored 0-100 with about 50 being neutral, which gives you a simple threshold to set targets against. Whatever tool you use, trend it. Presenc AI points out that sentiment can decay even while mention rate holds steady, which makes it an early indicator of reputation trouble.
If sentiment is weak, the cause is often a third-party source. Promptwatch's report notes that on brand prompts, the review sites and forums in a short source list shape how ChatGPT describes you. That sends the fix off your own domain and into reputation and review work.
What the four KPIs tell you together
The real value is in reading them as a set. Here is a quick diagnostic table.
| Pattern | Most likely problem | Where to look first |
|---|---|---|
| Low Visibility Score, low SoV | Coverage gap | Content gap analysis, missing topics |
| Good Visibility Score, low SoV | Competitors outpacing you | Competitor prompts, comparison content |
| Mentioned but late Position | Prominence problem | Stronger evidence, third-party citations |
| Mentions without self-citations | Content or crawlability problem | Crawler access, page quality |
| Rising visibility, falling Sentiment | Reputation problem | Review sites, forums, accuracy of descriptions |
| Strong on one platform, weak on another | Platform-specific gap | Per-engine segmentation |
Segment before you set targets
A single blended number is the most common reporting mistake. Cognizo says it directly: a brand can hold a strong score on ChatGPT and a weak one on Perplexity for the same prompts. Segment along three axes.
By platform
Track ChatGPT, Google AI Overviews, Google AI Mode, Gemini, Perplexity, and Copilot at a minimum, then weight by where your buyers actually ask questions. Do not weight a small platform equally just because it is easy to track.
Promptwatch Data on average sources per response shows why engines behave differently: ChatGPT cites about 5 sources per answer, Google AI Overviews about 10, and Perplexity almost exactly 10 every day. The report also notes Perplexity's stable count makes it a clean test bench, since a change in your citations there more likely reflects your content than engine noise. Copilot swung from under 2 to nearly 17 sources per response within weeks, so judge it on monthly trends. See Promptwatch's average sources per response data.
By prompt type
Split prompts into organic (no brand named), brand-specific, and competitor comparison. The same Promptwatch report on unique domains found sharp differences: 52.5% of organic prompts cite 10 or more domains, versus 21.3% of brand-specific prompts, where 5 domains is the most common count. Your baseline on brand prompts will look very different from your baseline on organic prompts, so one blended target misleads. Set separate KPIs for each.
By funnel stage and topic
Leading on awareness prompts while trailing on comparison and purchase prompts is a very different position than the reverse. Tag prompts by funnel stage and product line so the report shows where you are losing deals, not just an average.
How to set baselines and targets
Step 1: build the prompt set
TopCited suggests 50 to 500 prompts per category. Start with 100 to 200 real buyer questions pulled from Search Console queries, People Also Ask, sales calls, and support tickets. Include organic, brand, and comparison prompts. Tools with prompt volume and difficulty data help you prioritize which ones actually matter.
Step 2: fix the competitor set
Pick 4 to 8 competitors, including at least one aspirational leader. Write the list down and do not change it mid-quarter.
Step 3: collect a 4 to 6 week baseline
Because results vary run to run, one week is not a baseline. Run prompts daily, and use the average. Note the volatility too. Visiblie suggests tracking it: if a prompt shows your brand in 7 of 10 runs, that prompt is unstable, and a gain there is weaker evidence than a gain on a prompt where you appear every time.
Step 4: set targets by gap, not by wish
Rather than "reach 50% visibility," set targets relative to the baseline and the competitor leader. Some examples:
- Close half the Share of Voice gap to the category leader on comparison prompts within two quarters.
- Lift mention rate on organic prompts in your top three topics by 10 points.
- Keep sentiment above a set floor and fix any factually wrong description within 30 days.
- Move average position from the back half of answers into the top three on priority prompts.
Be honest in the target-setting meeting. Moves of a point or two inside the noise band are not wins.
Step 5: add business outcome KPIs
The four KPIs are leading indicators. Pair them with outcomes: AI-referred sessions, conversions from AI traffic, and the share of pipeline traced to AI discovery. Local Dominator quotes Flywheel Digital's Natasha Burtenshaw-deVries on wanting impact from AI "not just visibility as a vanity metric." Click-based referral is a weak measure on its own because many AI answers include no link, so treat it as a floor and not the whole picture.
A sample KPI scorecard
| KPI | What it answers | Segment by | Reporting cadence | Example target |
|---|---|---|---|---|
| Visibility Score | Does AI name us? | Platform, prompt type, topic | Weekly trend, monthly review | +10 points on organic prompts in 2 quarters |
| Share of Voice | How do we compare? | Competitor, topic, funnel stage | Monthly | Close half the gap to leader |
| Position | How prominent are we? | Platform, prompt type | Monthly | Average position in top 3 on priority prompts |
| Sentiment | How are we described? | Platform, source type | Monthly, alert on drops | Hold above neutral, fix inaccuracies in 30 days |
| AI traffic and conversions | Does it pay off? | Platform, landing page | Monthly | Conversion rate at or above organic |
Tools for tracking the KPIs
You need a tool that runs a fixed prompt set repeatedly across engines, stores the responses, and calculates the metrics consistently. The catalog is crowded, so here is a short, opinionated orientation.
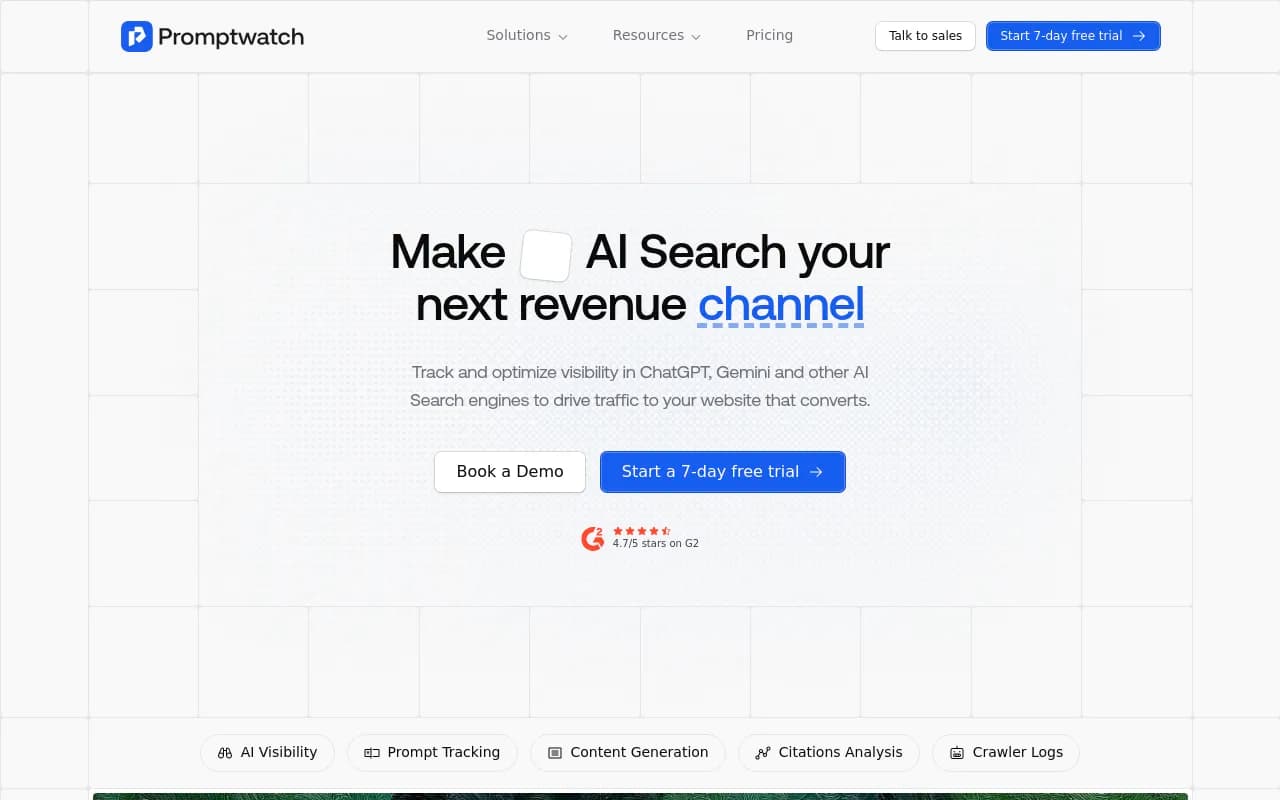
Promptwatch tracks Visibility Score, Share of Voice, Position, and Sentiment from the real interfaces of ChatGPT, Google AI Overviews, AI Mode, Gemini, Perplexity, and Copilot. The part I find most useful for KPI work is that it also shows prompt volumes and difficulty, IP-verified AI crawler logs, and AI-referred visitor analytics, so you can connect the KPIs to a cause and to traffic. Its content gap analysis and Action Board then turn a weak KPI into a to-do list.
Other tools worth a look depending on budget and team size:
A rough guide to how they differ:
| Tool type | Examples | Good for | Watch out for |
|---|---|---|---|
| End-to-end GEO platform | Promptwatch | KPIs plus crawler logs, traffic, and content actions | More to learn than a pure tracker |
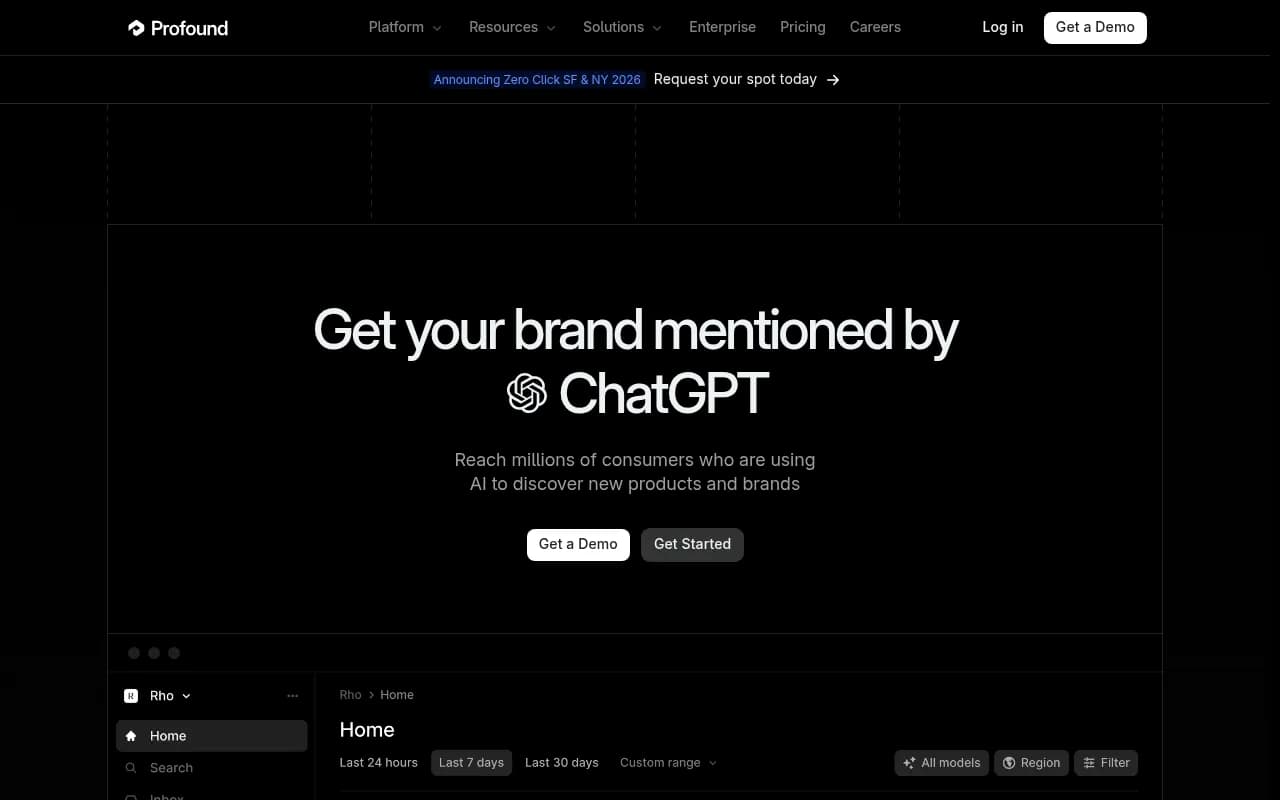
| Enterprise monitoring | Profound | Large brands needing deep monitoring | Higher price points |
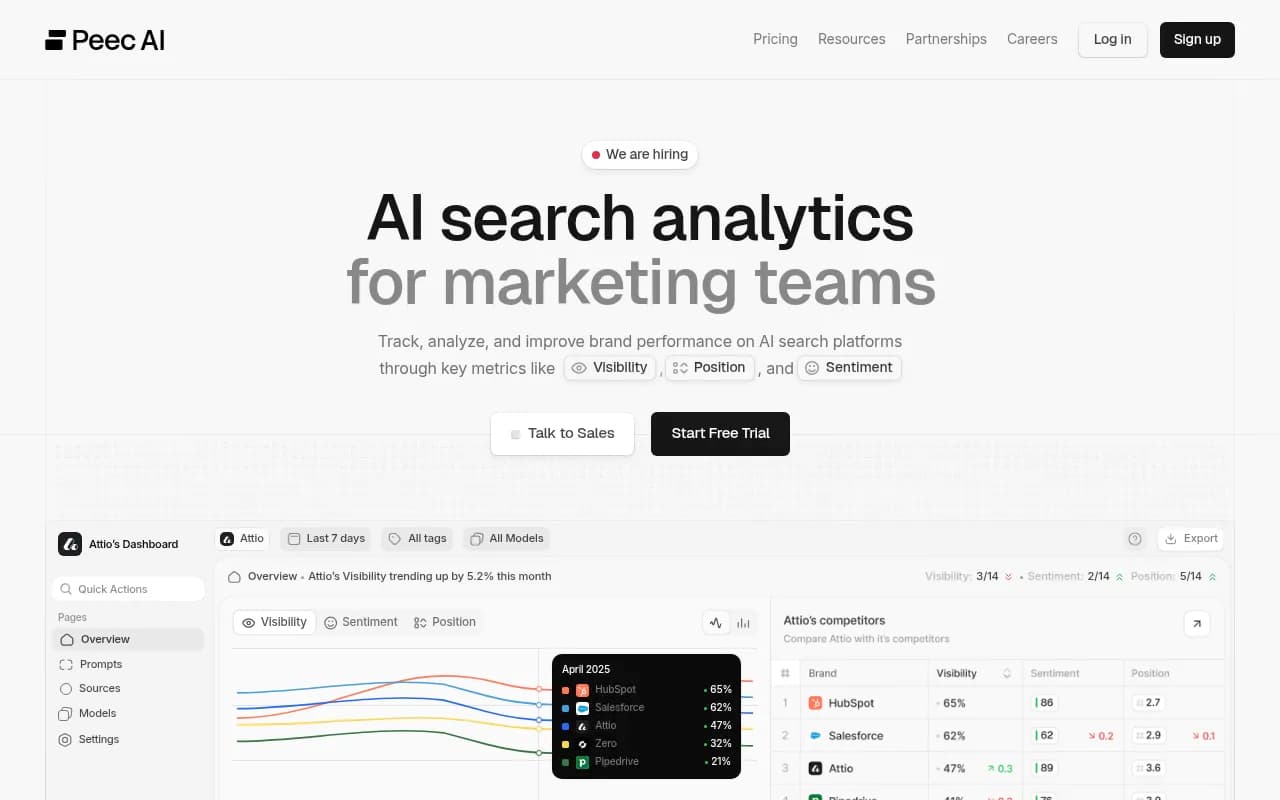
| Lightweight trackers | Peec AI, Otterly.AI | Small teams starting a baseline | Often no crawler logs or content workflow |
| SEO suites with AI add-ons | Semrush One, Ahrefs Brand Radar | Teams already in those suites | Fixed prompt sets, shallower AI data |
If you want to browse more options, the GEO software directory at bestgeosoftware.com lists a much wider set.
Reporting to leadership
Executives do not want six charts. Semrush suggests structuring the report around competitive position: your rank on your top 10 category prompts against your top two competitors, shown as gains and losses by prompt. That format works.
A one-page version:
- Headline: Visibility Score and Share of Voice trend versus last quarter and versus the leader.
- Quality: Position and Sentiment, with any inaccurate descriptions flagged.
- Impact: AI-referred traffic and conversions.
- Movers: the five prompts gained and five lost, with the cause when known.
- Next actions: three prioritized fixes.
Keep the competitor set and prompt set stable across the report so the trend lines mean something. When you change them, annotate it.
Common mistakes
- Reporting one blended Visibility Score across platforms and prompt types.
- Treating a single run as a ranking.
- Celebrating mention counts while sentiment slips.
- Changing the competitor set mid-period.
- Setting a flat percentage target with no reference to the category structure or the leader.
- Ignoring that AI answers shift with model updates. Promptwatch Data recorded a drop in average citations per ChatGPT response around the GPT-5.3 rollout on March 4, 2026, so annotate your charts when platforms change (citation drop report).
- Expecting clicks to carry the story. Many AI answers resolve without one.
Where to start this week
Pick the four KPIs, write down the competitor list, and build the first 100 prompts split across organic, brand, and comparison types. Run them daily for a month before anyone sets a number. Then set targets relative to the leader and report the trend, not the snapshot. For wider context on how AI engines build answers, Promptwatch Data at promptwatch.com/data publishes regularly updated research you can use to sanity-check your own baselines.